List of causes of death by rate
The following is a list of the causes of human deaths worldwide for different years arranged by their associated mortality rates. In 2002, there were about 57 million deaths. In 2005, according to the World Health Organization (WHO) using the International Statistical Classification of Diseases and Related Health Problems (ICD), about 58 million people died.[1] In 2010, according to the Institute for Health Metrics and Evaluation, 52.8 million people died.[2] In 2016, the WHO recorded 56.7 million deaths[3] with the leading cause of death as cardiovascular disease causing more than 17 million deaths (about 31% of the total) as shown in the chart to the side.

Some causes listed include deaths also included in more specific subordinate causes, and some causes are omitted, so the percentages may only sum approximately to 100%. The causes listed are relatively immediate medical causes, but the ultimate cause of death might be described differently. For example, tobacco smoking often causes lung disease or cancer, and alcohol use disorder can cause liver failure or a motor vehicle accident. For statistics on preventable ultimate causes, see preventable causes of death.
Besides frequency, other measures to compare, consider and monitor trends of causes of deaths include disability-adjusted life year (DALY) and years of potential life lost (YPLL).
By frequency
Age standardized death rate, per 100,000, by cause, in 2017, and percentage change 2007–2017.[4]
Overview table
This first table gives a convenient overview of the general categories and broad causes. The leading cause is cardiovascular disease at 31.59% of all deaths.
| Category | Cause | Percent of all deaths |
Percent of all deaths |
| I. Communicable, maternal, neonatal, and nutritional disorders | Respiratory infections and tuberculosis | 6.85 | 19.49% |
| Enteric infections | 3.31 | ||
| Sexually transmitted infections | 1.88 | ||
| Tropical diseases and malaria | 1.37 | ||
| Other infectious diseases | 1.57 | ||
| Maternal and neonatal disorders | 4.00 | ||
| Nutritional deficiencies | 0.52 | ||
| II. Non-communicable diseases | Cardiovascular diseases | 31.59 | 72.67% |
| Neoplasms | 16.43 | ||
| Chronic respiratory diseases | 6.97 | ||
| Digestive diseases | 4.11 | ||
| Neurological disorders | 5.84 | ||
| Substance abuse | 0.58 | ||
| Diabetes and kidney diseases | 4.55 | ||
| Skin diseases | 0.18 | ||
| Musculoskeletal disorders | 0.22 | ||
| Other non-communicable | 2.22 | ||
| III. Injuries | Transport injuries | 2.30 | 7.85% |
| Unintentional injuries | 3.23 | ||
| Self harm and violence | 2.32 | ||
| Total | 100% | 100% | |
Detailed table
This second table gives a more detailed and specific breakdown of the causes.
| Cause | Rate | Percent of all deaths | Percent Change 2007–2017 |
|---|---|---|---|
| All causes | 737.7 (729.9 to 745.4) | 100% | -14.2 (-15.0 to -13.5) |
| I. Communicable, maternal, neonatal, and nutritional disorders | 143.8 (138.4 to 151.6) | 19.49% | -31.8 (-33.3 to -30.1) |
| Respiratory infections and tuberculosis | 50.5 (48.8 to 52.3) | 6.85% | -24.5 (-26.4 to -22.6) |
| Tuberculosis | 14.9 (14.3 to 15.7) | 2.02% | -31.4 (-34.1 to -27.6) |
| Drug-susceptible tuberculosis | 13.2 (12.0 to 14.2) | 1.79% | -31.9 (-37.3 to -26.4) |
| Multidrug-resistant tuberculosis without extensive drug resistance | 1.6 (0.9 to 2.5) | 0.22% | -28.6 (-57.4 to 11.4) |
| Extensively drug-resistant tuberculosis | 0.2 (0.1 to 0.2) | 0.03% | -7.7 (-34.1 to 28.8) |
| Lower respiratory infections | 35.4 (33.8 to 36.8) | 4.80% | -21.1 (-23.2 to -18.9) |
| Upper respiratory infections | 0.1 (0.1 to 0.2) | 0.01% | -42.1 (-49.6 to -29.9) |
| Otitis media | 0.0 (0.0 to 0.0) | 0.00% | -50.4 (-58.8 to -39.9) |
| Enteric infections | 24.4 (19.5 to 32.4) | 3.31% | -29.9 (-34.9 to -23.1) |
| Diarrhoeal diseases | 21.6 (16.4 to 29.7) | 2.93% | -30.2 (-36.1 to -22.7) |
| Typhoid and paratyphoid | 1.9 (1.1 to 3.0) | 0.26% | -27.8 (-32.8 to -23.9) |
| (Typhoid fever) | 1.6 (0.9 to 2.6) | 0.22% | -29.1 (-34.1 to -25.0) |
| (Paratyphoid fever) | 0.3 (0.1 to 0.5) | 0.04% | -18.9 (-26.1 to -10.8) |
| iNTS | 0.8 (0.5 to 1.4) | 0.11% | -24.8 (-31.9 to -15.6) |
| Other intestinal infectious diseases | 0.0 (0.0 to 0.0) | 0.00% | -44.7 (-70.1 to 2.3) |
| Sexually transmitted infections | 13.9 (12.6 to 15.5) | 1.88% | -53.6 (-55.8 to -51.0) |
| HIV/AIDS | 12.1 (11.5 to 12.9) | 1.64% | -56.5 (-58.0 to -54.7) |
| HIV/AIDS – Drug-susceptible Tuberculosis | 2.5 (1.8 to 3.2) | 0.34% | -61.1 (-63.7 to -57.7) |
| HIV/AIDS – Multidrug-resistant Tuberculosis without extensive drug resistance | 0.3 (0.2 to 0.4) | 0.04% | -58.1 (-70.5 to -41.5) |
| HIV/AIDS – Extensively drug-resistant Tuberculosis | 0.0 (0.0 to 0.0) | 0.00% | -20.3 (-36.4 to -0.2) |
| HIV/AIDS resulting in other diseases | 9.3 (8.4 to 10.4) | 1.26% | -55.1 (-57.2 to -52.6) |
| Sexually transmitted infections excluding HIV | 1.8 (0.7 to 3.3) | 0.24% | -14.4 (-21.5 to -6.6) |
| Syphilis | 1.7 (0.7 to 3.2) | 0.23% | -14.3 (-21.8 to -6.4) |
| Chlamydial infection | 0.0 (0.0 to 0.0) | 0.00% | -15.2 (-21.0 to -8.4) |
| Gonococcal infection | 0.0 (0.0 to 0.0) | 0.00% | -14.9 (-20.8 to -8.2) |
| Other sexually transmitted infections | 0.0 (0.0 to 0.0) | 0.00% | -15.9 (-21.6 to -9.5) |
| Neglected tropical diseases and malaria | 10.1 (7.5 to 13.2) | 1.37% | -36.1 (-43.7 to -27.3) |
| Malaria | 8.7 (6.1 to 11.9) | 1.18% | -37.3 (-45.4 to -27.9) |
| Chagas disease | 0.1 (0.1 to 0.1) | 0.01% | -21.1 (-25.2 to -14.3) |
| Leishmaniasis | 0.1 (0.0 to 0.5) | 0.01% | -67.8 (-97.5 to -50.3) |
| (Visceral leishmaniasis) | 0.1 (0.0 to 0.5) | 0.01% | -67.8 (-97.5 to -50.3) |
| African trypanosomiasis (sleeping sickness) | 0.0 (0.0 to 0.1) | 0.00% | -82.8 (-96.0 to -34.3) |
| Schistosomiasis | 0.1 (0.1 to 0.1) | 0.01% | -28.5 (-32.7 to -23.7) |
| Cysticercosis | 0.0 (0.0 to 0.0) | 0.00% | -27.3 (-50.5 to 5.3) |
| Cystic echinococcosis | 0.0 (0.0 to 0.0) | 0.00% | -41.9 (-59.8 to -19.0) |
| Dengue | 0.5 (0.2 to 0.7) | 0.07% | 40.7 (3.6 to 69.7) |
| Yellow fever | 0.1 (0.0 to 0.2) | 0.01% | -23.3 (-34.4 to -9.6) |
| Rabies | 0.2 (0.1 to 0.2) | 0.03% | -54.8 (-63.8 to -45.0) |
| Intestinal nematode infections | 0.0 (0.0 to 0.1) | 0.00% | -47.2 (-59.5 to -30.1) |
| (Ascariasis) | 0.0 (0.0 to 0.1) | 0.00% | -47.2 (-59.5 to -30.1) |
| Ebola virus disease | 0.0 (0.0 to 0.0) | 0.00% | -98.4 (-98.4 to -98.4) |
| Zika virus disease | 0.0 (0.0 to 0.0) | 0.00% | - |
| Other neglected tropical diseases | 0.2 (0.1 to 0.5) | 0.03% | -3.7 (-18.3 to 13.9) |
| Other infectious diseases | 11.6 (10.1 to 13.3) | 1.57% | -33.8 (-39.3 to -27.4) |
| Meningitis | 4.0 (3.6 to 4.6) | 0.54% | -27.8 (-33.1 to -19.3) |
| Pneumococcal meningitis | 0.6 (0.5 to 0.7) | 0.08% | -22.4 (-28.9 to -12.4) |
| H influenzae type B meningitis | 1.1 (0.9 to 1.3) | 0.15% | -40.6 (-45.8 to -33.9) |
| Meningococcal infection | 0.4 (0.4 to 0.5) | 0.05% | -37.1 (-42.6 to -29.2) |
| Other meningitis | 2.0 (1.7 to 2.3) | 0.27% | -17.3 (-23.4 to -7.5) |
| Encephalitis | 1.2 (1.1 to 1.4) | 0.16% | -14.3 (-26.5 to -0.9) |
| Diphtheria | 0.1 (0.0 to 0.1) | 0.01% | -28.6 (-58.8 to 29.2) |
| Whooping cough (pertussis) | 1.4 (0.7 to 2.4) | 0.19% | -27.1 (-57.1 to 28.8) |
| Tetanus | 0.5 (0.4 to 0.7) | 0.07% | -59.6 (-69.3 to -45.0) |
| Measles | 1.4 (0.5 to 3.1) | 0.19% | -59.3 (-64.0 to -54.4) |
| Varicella (chickenpox) and herpes zoster (shingles) | 0.2 (0.2 to 0.2) | 0.03% | -29.2 (-34.7 to -23.4) |
| Acute hepatitis | 1.6 (1.2 to 1.9) | 0.22% | -24.5 (-29.2 to -18.4) |
| Acute hepatitis A | 0.3 (0.2 to 0.3) | 0.04% | -38.7 (-46.8 to -28.6) |
| Acute hepatitis B | 1.1 (0.8 to 1.3) | 0.15% | -19.6 (-25.4 to -12.4) |
| Acute hepatitis C | 0.0 (0.0 to 0.1) | 0.00% | -32.1 (-42.4 to -19.6) |
| Acute hepatitis E | 0.2 (0.1 to 0.2) | 0.03% | -25.8 (-35.3 to -15.6) |
| Other unspecified infectious diseases | 1.1 (0.8 to 1.2) | 0.15% | -13.4 (-17.5 to -8.1) |
| Maternal and neonatal disorders | 29.5 (28.2 to 30.8) | 4.00% | -26.6 (-29.3 to -23.5) |
| Maternal disorders | 2.5 (2.3 to 2.7) | 0.34% | -30.7 (-34.8 to -26.6) |
| Maternal haemorrhage | 0.5 (0.4 to 0.6) | 0.07% | -56.4 (-62.7 to -49.3) |
| Maternal sepsis and other pregnancy related infections (e.g. Postpartum infections) | 0.3 (0.2 to 0.3) | 0.04% | -33.5 (-44.2 to -22.6) |
| Maternal hypertensive disorders | 0.4 (0.3 to 0.4) | 0.05% | -13.0 (-27.3 to 2.6) |
| Maternal obstructed labour and uterine rupture | 0.2 (0.1 to 0.2) | 0.03% | -25.2 (-41.0 to -6.3) |
| Maternal abortive outcome | 0.2 (0.2 to 0.3) | 0.03% | -15.7 (-29.3 to -0.4) |
| Ectopic pregnancy | 0.1 (0.1 to 0.2) | 0.01% | -19.2 (-46.2 to 16.8) |
| Indirect maternal deaths | 0.4 (0.4 to 0.5) | 0.05% | -12.5 (-24.0 to -1.0) |
| Late maternal deaths | 0.0 (0.0 to 0.1) | 0.00% | -9.5 (-14.7 to -4.0) |
| Maternal deaths aggravated by HIV/AIDS | 0.0 (0.0 to 0.0) | 0.00% | -32.1 (-38.4 to -25.2) |
| Other maternal disorders | 0.3 (0.3 to 0.4) | 0.04% | -16.5 (-31.2 to 1.5) |
| Neonatal disorders | 27.1 (25.8 to 28.3) | 3.67% | -26.2 (-29.1 to -22.7) |
| Neonatal preterm birth | 9.9 (9.2 to 10.9) | 1.34% | -28.1 (-33.2 to -23.6) |
| Neonatal encephalopathy due to birth asphyxia and trauma | 8.1 (7.2 to 8.8) | 1.10% | -26.5 (-32.0 to -20.2) |
| Neonatal sepsis and other neonatal infections | 3.1 (2.7 to 4.1) | 0.42% | -14.4 (-22.7 to -4.4) |
| Hemolytic disease and other neonatal jaundice | 0.7 (0.7 to 0.8) | 0.09% | -39.3 (-46.8 to -30.2) |
| Other neonatal disorders | 5.3 (4.5 to 5.8) | 0.72% | -25.7 (-31.7 to -17.8) |
| Nutritional deficiencies | 3.8 (3.5 to 4.2) | 0.52% | -33.6 (-38.1 to -26.5) |
| Protein-energy malnutrition | 3.3 (3.0 to 3.7) | 0.45% | -34.6 (-39.4 to -27.5) |
| Other nutritional deficiencies | 0.5 (0.4 to 0.6) | 0.07% | -25.8 (-31.7 to -17.5) |
| II. Non-communicable diseases | 536.1 (528.4 to 542.2) | 72.67% | -7.9 (-8.8 to -7.0) |
| Cardiovascular diseases | 233.1 (229.7 to 236.4) | 31.60% | -10.3 (-11.4 to -9.3) |
| Rheumatic heart disease | 3.7 (3.4 to 3.9) | 0.50% | -21.3 (-25.2 to -17.8) |
| Ischaemic heart disease | 116.9 (115.1 to 119.7) | 15.85% | -9.7 (-11.0 to -8.7) |
| Stroke | 80.5 (78.9 to 82.6) | 10.91% | -13.6 (-15.0 to -12.1) |
| Ischaemic stroke | 36.6 (35.5 to 38.0) | 4.96% | -11.8 (-13.4 to -10.3) |
| Intracerebral hemorrhage | 38.2 (37.0 to 39.4) | 5.18% | -15.7 (-17.8 to -13.8) |
| Subarachnoid hemorrhage | 5.7 (5.3 to 6.3) | 0.77% | -9.4 (-13.1 to -4.9) |
| Hypertensive heart disease | 12.3 (9.0 to 13.2) | 1.67% | 7.5 (-7.3 to 16.3) |
| Non-rheumatic valvular heart disease | 2.0 (1.6 to 2.0) | 0.27% | -5.3 (-7.9 to -3.2) |
| Non-rheumatic calcific aortic valve disease | 1.4 (1.1 to 1.5) | 0.19% | -1.0 (-5.6 to 2.2) |
| Non-rheumatic degenerative mitral valve disease | 0.5 (0.4 to 0.6) | 0.07% | -14.0 (-18.1 to -8.6) |
| Other non-rheumatic valve diseases | 0.1 (0.1 to 0.1) | 0.01% | -17.8 (-28.5 to 8.0) |
| Cardiomyopathy and myocarditis | 4.8 (4.5 to 5.0) | 0.65% | -16.6 (-19.8 to -9.4) |
| Myocarditis | 0.6 (0.5 to 0.7) | 0.08% | -13.3 (-20.4 to -0.1) |
| Alcoholic cardiomyopathy | 1.1 (1.0 to 1.2) | 0.15% | -40.5 (-43.7 to -27.6) |
| Other cardiomyopathy | 3.1 (2.8 to 3.3) | 0.42% | -3.6 (-6.7 to -0.7) |
| Atrial fibrillation and flutter | 4.0 (3.9 to 4.2) | 0.54% | 2.6 (0.9 to 4.6) |
| Aortic aneurysm | 2.2 (2.1 to 2.3) | 0.30% | -8.5 (-11.2 to -5.8) |
| Peripheral vascular disease | 1.0 (0.6 to 1.7) | 0.14% | 10.5 (-6.8 to 24.1) |
| Endocarditis | 1.1 (1.0 to 1.2) | 0.15% | 1.0 (-4.0 to 5.0) |
| Other cardiovascular and circulatory diseases | 4.7 (4.4 to 5.1) | 0.64% | -7.9 (-10.9 to -5.9) |
| Neoplasms | 121.2 (119.1 to 122.9) | 16.43% | -4.4 (-5.6 to -3.3) |
| Lip and oral cavity cancer | 2.4 (2.3 to 2.5) | 0.33% | 4.0 (-0.6 to 8.0) |
| Nasopharynx cancer | 0.9 (0.8 to 0.9) | 0.12% | -3.0 (-6.4 to 0.4) |
| Other pharynx cancer | 1.4 (1.3 to 1.5) | 0.19% | 7.9 (-0.3 to 14.0) |
| Oesophageal cancer | 5.5 (5.3 to 5.6) | 0.75% | -14.5 (-16.9 to -12.0) |
| Stomach cancer | 11.0 (10.8 to 11.2) | 1.49% | -17.1 (-18.8 to -15.1) |
| Colon and rectum cancer | 11.5 (11.3 to 11.8) | 1.56% | -4.3 (-7.1 to -1.8) |
| Liver cancer | 10.2 (9.8 to 10.7) | 1.38% | -2.5 (-5.6 to 2.0) |
| (Liver cancer due to hepatitis B) | 4.0 (3.7 to 4.3) | 0.54% | -6.2 (-10.0 to 0.1) |
| (Liver cancer due to hepatitis C) | 3.0 (2.8 to 3.2) | 0.41% | -2.1 (-4.9 to 1.4) |
| (Liver cancer due to alcohol use) | 1.6 (1.4 to 1.8) | 0.22% | 0.6 (-3.0 to 4.8) |
| (Liver cancer due to NASH) | 0.8 (0.8 to 0.9) | 0.11% | 7.6 (4.4 to 11.7) |
| (Liver cancer due to other causes) | 0.8 (0.7 to 0.9) | 0.11% | -0.9 (-4.2 to 3.6) |
| Gallbladder and biliary tract cancer | 2.2 (2.0 to 2.4) | 0.30% | -6.7 (-9.4 to -4.0) |
| Pancreatic cancer | 5.6 (5.5 to 5.7) | 0.76% | 4.8 (2.5 to 6.8) |
| Larynx cancer | 1.6 (1.5 to 1.6) | 0.22% | -7.7 (-10.1 to -5.2) |
| Tracheal, bronchus, and lung cancer | 23.7 (23.3 to 24.2) | 3.21% | -2.0 (-4.3 to 0.1) |
| Malignant skin melanoma | 0.8 (0.6 to 0.9) | 0.11% | -5.1 (-8.5 to -2.5) |
| Non-melanoma skin cancer | 0.8 (0.8 to 0.9) | 0.11% | 2.7 (0.0 to 4.5) |
| (Non-melanoma skin cancer (squamous-cell carcinoma)) | 0.8 (0.8 to 0.9) | 0.11% | 2.7 (0.0 to 4.5) |
| Breast cancer | 7.6 (7.4 to 8.0) | 1.03% | -2.6 (-6.9 to 0.4) |
| Cervical cancer | 3.2 (3.0 to 3.3) | 0.43% | -7.2 (-11.7 to -4.0) |
| Uterine cancer | 1.1 (1.0 to 1.1) | 0.15% | -10.4 (-12.5 to -7.7) |
| Ovarian cancer | 2.2 (2.1 to 2.3) | 0.30% | -1.0 (-3.6 to 1.6) |
| Prostate cancer | 5.5 (4.7 to 6.5) | 0.75% | -2.5 (-4.9 to 1.9) |
| Testicular cancer | 0.1 (0.1 to 0.1) | 0.01% | -9.4 (-12.6 to -5.2) |
| Kidney cancer | 1.8 (1.6 to 1.8) | 0.24% | -1.3 (-4.3 to 1.7) |
| Bladder cancer | 2.6 (2.5 to 2.7) | 0.35% | -5.4 (-7.3 to -3.4) |
| Brain and nervous system cancer | 3.1 (2.7 to 3.3) | 0.42% | 3.8 (-1.0 to 7.0) |
| Thyroid cancer | 0.5 (0.5 to 0.6) | 0.07% | -1.2 (-4.5 to 2.0) |
| Mesothelioma | 0.4 (0.4 to 0.4) | 0.05% | -3.4 (-8.4 to 0.7) |
| Hodgkin lymphoma | 0.4 (0.4 to 0.5) | 0.05% | -16.8 (-19.8 to -14.0) |
| Non-Hodgkin's lymphoma | 3.2 (3.1 to 3.2) | 0.43% | 0.1 (-2.7 to 2.4) |
| Multiple myeloma | 1.4 (1.3 to 1.5) | 0.19% | -0.4 (-3.5 to 2.4) |
| Leukaemia | 4.5 (4.1 to 4.7) | 0.61% | -9.6 (-12.2 to -7.4) |
| Acute lymphoid leukaemia | 0.7 (0.6 to 0.7) | 0.09% | -1.5 (-11.6 to 6.2) |
| Chronic lymphoid leukaemia | 0.5 (0.4 to 0.5) | 0.07% | -10.3 (-13.0 to -7.6) |
| Acute myeloid leukaemia | 1.3 (1.2 to 1.3) | 0.18% | -1.0 (-6.6 to 3.0) |
| Chronic myeloid leukaemia | 0.3 (0.3 to 0.3) | 0.04% | -19.9 (-22.2 to -17.6) |
| Other leukaemia | 1.8 (1.6 to 1.9) | 0.24% | -15.6 (-18.7 to -12.1) |
| Other malignant cancers | 4.6 (4.2 to 4.8) | 0.62% | 0.1 (-2.6 to 2.2) |
| Other neoplasms | 1.3 (1.0 to 1.6) | 0.18% | 7.4 (2.1 to 15.8) |
| Myelodysplastic, myeloproliferative, and other hematopoietic neoplasms | 1.3 (1.0 to 1.5) | 0.18% | 7.1 (1.8 to 15.3) |
| Other benign and in situ neoplasms | 0.1 (0.0 to 0.1) | 0.01% | 15.5 (4.1 to 29.2) |
| Chronic respiratory diseases | 51.4 (49.7 to 53.1) | 6.97% | -14.2 (-16.5 to -11.5) |
| Chronic obstructive pulmonary disease | 42.2 (40.0 to 44.2) | 5.72% | -13.6 (-16.5 to -11.0) |
| Pneumoconiosis | 0.3 (0.3 to 0.3) | 0.04% | -16.7 (-20.8 to -12.4) |
| (Silicosis) | 0.1 (0.1 to 0.2) | 0.01% | -15.5 (-23.6 to -7.4) |
| (Asbestosis) | 0.0 (0.0 to 0.1) | 0.00% | -8.3 (-14.1 to -0.4) |
| (Coal workers pneumoconiosis) | 0.0 (0.0 to 0.1) | 0.00% | -26.6 (-33.8 to -16.7) |
| (Other pneumoconiosis) | 0.0 (0.0 to 0.1) | 0.00% | -17.5 (-24.1 to -5.0) |
| Asthma | 6.3 (4.3 to 8.2) | 0.85% | -23.9 (-28.1 to -17.2) |
| Interstitial lung disease and pulmonary sarcoidosis | 1.9 (1.5 to 2.4) | 0.26% | 11.4 (4.0 to 17.9) |
| Other chronic respiratory diseases | 0.7 (0.6 to 0.8) | 0.09% | -3.2 (-8.7 to 6.7) |
| Digestive diseases | 30.3 (29.2 to 32.1) | 4.11% | -10.7 (-13.1 to -7.3) |
| Cirrhosis and other chronic liver diseases | 16.5 (15.8 to 18.1) | 2.24% | -9.7 (-14.7 to -4.6) |
| Cirrhosis and other chronic liver diseases due to hepatitis B | 4.8 (4.3 to 5.5) | 0.65% | -14.3 (-20.2 to -7.3) |
| Cirrhosis and other chronic liver diseases due to hepatitis C | 4.2 (3.9 to 4.7) | 0.57% | -8.4 (-13.0 to -3.9) |
| Cirrhosis and other chronic liver diseases due to alcohol use | 4.1 (3.7 to 4.6) | 0.56% | -8.8 (-13.2 to -3.4) |
| Cirrhosis due to NASH | 1.5 (1.3 to 1.6) | 0.20% | -1.4 (-6.3 to 3.1) |
| Cirrhosis and other chronic liver diseases due to other causes | 1.9 (1.7 to 2.1) | 0.26% | -8.6 (-13.4 to -3.8) |
| Upper digestive system diseases | 3.8 (3.6 to 4.0) | 0.52% | -21.6 (-24.8 to -17.3) |
| Peptic ulcer disease | 3.1 (3.0 to 3.3) | 0.42% | -23.5 (-26.6 to -19.7) |
| Gastritis and duodenitis | 0.7 (0.6 to 0.7) | 0.09% | -11.7 (-17.6 to -2.2) |
| Appendicitis | 0.6 (0.5 to 0.6) | 0.08% | -17.0 (-21.5 to -10.7) |
| Paralytic ileus and intestinal obstruction | 3.2 (2.7 to 3.5) | 0.43% | -5.8 (-11.0 to 0.3) |
| Inguinal, femoral, and abdominal hernia | 0.6 (0.5 to 0.7) | 0.08% | -8.9 (-12.9 to -4.2) |
| Inflammatory bowel disease | 0.5 (0.4 to 0.5) | 0.07% | -10.5 (-16.0 to -5.9) |
| Vascular intestinal disorders | 1.3 (1.2 to 1.3) | 0.18% | -10.2 (-14.2 to -6.2) |
| Gallbladder and biliary diseases | 1.5 (1.4 to 1.6) | 0.20% | -5.0 (-7.5 to -1.7) |
| Pancreatitis | 1.3 (1.1 to 1.4) | 0.18% | -5.7 (-9.0 to -1.7) |
| Other digestive diseases | 1.2 (1.1 to 1.2) | 0.16% | -7.1 (-12.1 to -2.4) |
| Neurological disorders | 43.1 (42.3 to 43.7) | 5.84% | 0.1 (-1.2 to 1.3) |
| Alzheimer's disease and other dementias | 35.4 (34.8 to 35.9) | 4.80% | 0.6 (-0.9 to 1.8) |
| Parkinson's disease | 4.6 (4.4 to 4.8) | 0.62% | 0.8 (-2.8 to 3.0) |
| Epilepsy | 1.7 (1.5 to 2.0) | 0.23% | -10.7 (-15.4 to -0.5) |
| Multiple sclerosis | 0.3 (0.2 to 0.3) | 0.04% | -3.9 (-14.5 to 0.4) |
| Motor neuron disease | 0.4 (0.4 to 0.5) | 0.05% | 1.2 (-2.4 to 4.5) |
| Other neurological disorders | 0.7 (0.7 to 0.8) | 0.09% | 2.0 (-3.9 to 6.8) |
| Mental disorders | 0.0 (0.0 to 0.0) | 0.00% | 7.5 (-1.4 to 15.9) |
| Eating disorders | 0.0 (0.0 to 0.0) | 0.00% | 7.5 (-1.4 to 15.9) |
| Anorexia nervosa | 0.0 (0.0 to 0.0) | 0.00% | 5.5 (-4.1 to 14.4) |
| Bulimia nervosa | 0.0 (0.0 to 0.0) | 0.00% | 13.5 (1.0 to 26.2) |
| Substance use disorders | 4.3 (4.1 to 4.5) | 0.58% | 2.0 (-1.0 to 5.0) |
| Alcohol use disorders | 2.3 (2.0 to 2.4) | 0.31% | -16.5 (-20.4 to -12.4) |
| Drug use disorders | 2.1 (2.0 to 2.1) | 0.28% | 34.1 (31.4 to 36.9) |
| Opioid use disorders | 1.4 (1.3 to 1.4) | 0.19% | 49.4 (42.5 to 59.2) |
| Cocaine use disorders | 0.1 (0.1 to 0.1) | 0.01% | 19.6 (9.2 to 33.0) |
| Amphetamine use disorders | 0.1 (0.0 to 0.1) | 0.01% | 8.7 (-14.0 to 20.7) |
| Other drug use disorders | 0.6 (0.5 to 0.6) | 0.08% | 11.3 (1.2 to 19.9) |
| Diabetes and kidney diseases | 33.6 (32.9 to 34.3) | 4.55% | 1.3 (-0.3 to 2.7) |
| Diabetes mellitus | 17.5 (17.1 to 17.9) | 2.37% | 1.2 (-0.7 to 3.1) |
| Diabetes mellitus type 1 | 4.3 (4.0 to 4.7) | 0.58% | -11.0 (-14.6 to -7.8) |
| Diabetes mellitus type 2 | 13.2 (12.7 to 13.7) | 1.79% | 5.9 (4.1 to 8.0) |
| Chronic kidney disease | 15.9 (15.5 to 16.3) | 2.16% | 1.5 (-0.9 to 3.2) |
| Chronic kidney disease due to diabetes mellitus type 1 | 0.9 (0.8 to 1.2) | 0.12% | -1.2 (-4.0 to 1.2) |
| Chronic kidney disease due to diabetes mellitus type 2 | 4.5 (4.0 to 5.1) | 0.61% | 4.2 (1.4 to 6.2) |
| Chronic kidney disease due to hypertension | 4.6 (4.0 to 5.2) | 0.62% | 3.2 (0.4 to 5.2) |
| Chronic kidney disease due to glomerulonephritis | 2.4 (2.1 to 2.8) | 0.33% | -1.3 (-3.2 to 0.7) |
| Chronic kidney disease due to other and unspecified causes | 3.4 (3.0 to 3.9) | 0.46% | -1.4 (-3.7 to 0.6) |
| Acute glomerulonephritis | 0.1 (0.1 to 0.2) | 0.01% | -9.5 (-14.5 to -3.5) |
| Skin and subcutaneous diseases | 1.3 (0.9 to 1.7) | 0.18% | 8.1 (2.7 to 16.5) |
| Bacterial skin diseases | 1.0 (0.6 to 1.3) | 0.14% | 12.7 (6.0 to 20.7) |
| (Cellulitis) | 0.2 (0.1 to 0.3) | 0.03% | 19.6 (9.8 to 28.2) |
| (Pyoderma) | 0.8 (0.5 to 0.9) | 0.11% | 10.5 (3.2 to 19.0) |
| Decubitus ulcer | 0.3 (0.2 to 0.4) | 0.04% | -5.1 (-12.2 to 9.2) |
| Other skin and subcutaneous diseases | 0.1 (0.0 to 0.1) | 0.01% | 3.3 (-3.5 to 14.4) |
| Musculoskeletal disorders | 1.6 (1.4 to 1.6) | 0.22% | -0.1 (-4.4 to 3.2) |
| Rheumatoid arthritis | 0.6 (0.5 to 0.7) | 0.08% | -5.9 (-12.9 to -1.2) |
| Other musculoskeletal disorders | 1.0 (0.9 to 1.0) | 0.14% | 3.9 (0.9 to 7.5) |
| Other non-communicable diseases | 16.3 (15.5 to 17.1) | 2.21% | -11.2 (-15.3 to -8.5) |
| Congenital anomalies | 8.7 (8.2 to 9.2) | 1.18% | -18.2 (-24.7 to -14.1) |
| Neural tube defects | 0.9 (0.7 to 1.3) | 0.12% | -16.5 (-27.6 to -4.8) |
| Congenital heart anomalies | 3.9 (3.2 to 4.6) | 0.53% | -21.8 (-28.1 to -14.1) |
| Orofacial clefts | 0.1 (0.0 to 0.1) | 0.01% | -41.9 (-55.9 to -25.1) |
| Down syndrome | 0.4 (0.3 to 0.5) | 0.05% | -5.2 (-14.2 to 7.0) |
| Other chromosomal abnormalities | 0.3 (0.2 to 0.4) | 0.04% | 0.3 (-10.1 to 13.2) |
| Congenital musculoskeletal and limb anomalies | 0.2 (0.1 to 0.2) | 0.03% | -12.8 (-20.9 to -4.5) |
| Urogenital congenital anomalies | 0.2 (0.1 to 0.2) | 0.03% | -8.5 (-17.1 to 2.1) |
| Digestive congenital anomalies | 0.8 (0.6 to 1.1) | 0.11% | -19.3 (-29.8 to -9.8) |
| Other congenital anomalies | 2.1 (1.5 to 2.6) | 0.28% | -15.9 (-23.3 to -4.5) |
| Urinary diseases and male infertility | 3.6 (3.5 to 3.7) | 0.49% | 5.7 (2.2 to 8.5) |
| Urinary tract infections | 2.7 (2.6 to 3.0) | 0.37% | 10.9 (7.2 to 14.5) |
| Urolithiasis (Kidney stone disease) | 0.2 (0.1 to 0.2) | 0.03% | -1.2 (-9.7 to 12.9) |
| Other urinary diseases | 0.7 (0.6 to 0.8) | 0.09% | -9.9 (-15.3 to -2.2) |
| Gynecological diseases | 0.1 (0.1 to 0.1) | 0.01% | -2.6 (-13.6 to 6.0) |
| Uterine fibroids | 0.0 (0.0 to 0.0) | 0.00% | 8.1 (-14.9 to 24.7) |
| Polycystic ovarian syndrome | 0.0 (0.0 to 0.0) | 0.00% | 1.0 (-22.5 to 34.8) |
| Endometriosis | 0.0 (0.0 to 0.0) | 0.00% | -3.2 (-23.8 to 25.5) |
| Genital prolapse | 0.0 (0.0 to 0.0) | 0.00% | -24.1 (-36.0 to -13.0) |
| Other gynecological diseases | 0.1 (0.1 to 0.1) | 0.01% | -3.6 (-12.2 to 5.9) |
| Hemoglobinopathies and hemolytic anaemias | 1.4 (1.1 to 1.8) | 0.19% | -11.3 (-17.6 to -4.8) |
| Thalassemias | 0.1 (0.1 to 0.1) | 0.01% | -27.9 (-36.5 to -17.2) |
| Sickle cell disorders | 0.5 (0.3 to 0.8) | 0.07% | -3.1 (-17.6 to 10.3) |
| G6PD deficiency | 0.2 (0.2 to 0.3) | 0.03% | -7.1 (-12.1 to -1.0) |
| Other hemoglobinopathies and hemolytic anaemias | 0.6 (0.5 to 0.6) | 0.08% | -16.1 (-18.7 to -13.4) |
| Endocrine, metabolic, blood, and immune disorders | 1.9 (1.5 to 2.0) | 0.26% | 0.8 (-5.0 to 4.4) |
| Sudden infant death syndrome | 0.6 (0.3 to 1.2) | 0.08% | -20.2 (-31.2 to -4.9) |
| III. Injuries | 57.9 (55.9 to 59.2) | 7.85% | -13.7 (-15.1 to -12.2) |
| Transport injuries | 17.0 (16.4 to 17.4) | 2.30% | -17.0 (-19.5 to -14.9) |
| Road injuries | 15.8 (15.2 to 16.3) | 2.14% | -17.1 (-19.7 to -14.9) |
| Pedestrian road injuries | 6.2 (5.9 to 6.8) | 0.84% | -21.4 (-25.5 to -17.9) |
| Cyclist road injuries | 0.9 (0.7 to 1.0) | 0.12% | -8.8 (-14.8 to -2.5) |
| Motorcyclist road injuries | 2.9 (2.5 to 3.0) | 0.39% | -12.4 (-19.5 to -7.3) |
| Motor vehicle road injuries | 5.8 (5.4 to 6.0) | 0.79% | -15.6 (-18.6 to -12.2) |
| Other road injuries | 0.1 (0.1 to 0.2) | 0.01% | -19.4 (-24.1 to -1.3) |
| Other transport injuries | 1.2 (1.1 to 1.4) | 0.16% | -15.5 (-19.5 to -10.9) |
| Unintentional injuries | 23.8 (22.4 to 24.7) | 3.23% | -15.3 (-17.3 to -12.8) |
| Falls | 9.2 (8.5 to 9.8) | 1.25% | -2.8 (-7.4 to 3.4) |
| Drowning | 4.0 (3.8 to 4.1) | 0.54% | -27.3 (-29.6 to -24.5) |
| Fire, heat, and hot substances | 1.6 (1.3 to 1.7) | 0.22% | -22.9 (-25.4 to -17.3) |
| Poisonings | 0.9 (0.7 to 1.0) | 0.12% | -20.8 (-28.4 to -12.5) |
| (Poisoning by carbon monoxide) | 0.5 (0.3 to 0.5) | 0.07% | -26.6 (-34.8 to -20.3) |
| (Poisoning by other means) | 0.5 (0.4 to 0.5) | 0.07% | -14.4 (-22.4 to -3.9) |
| Exposure to mechanical forces | 1.8 (1.5 to 1.8) | 0.24% | -20.3 (-22.9 to -17.8) |
| (Unintentional firearm injuries) | 0.3 (0.3 to 0.3) | 0.04% | -16.4 (-20.3 to -11.5) |
| (Other exposure to mechanical forces) | 1.5 (1.2 to 1.6) | 0.20% | -21.0 (-23.7 to -18.3) |
| Adverse effects of medical treatment | 1.6 (1.4 to 1.8) | 0.22% | -6.2 (-10.0 to -2.5) |
| Animal contact | 1.1 (0.6 to 1.2) | 0.15% | -16.0 (-20.5 to -9.6) |
| (Venomous animal contact) | 0.9 (0.5 to 1.1) | 0.12% | -16.0 (-21.0 to -9.7) |
| (Non-venomous animal contact) | 0.1 (0.1 to 0.2) | 0.01% | -16.1 (-27.4 to -6.2) |
| Foreign body | 1.7 (1.6 to 1.8) | 0.23% | -14.1 (-17.0 to -11.6) |
| (Pulmonary aspiration and foreign body in airway) | 1.6 (1.5 to 1.7) | 0.22% | -13.9 (-17.0 to -11.4) |
| (Foreign body in other body part) | 0.1 (0.1 to 0.1) | 0.01% | -15.8 (-20.8 to -10.0) |
| Environmental heat and cold exposure | 0.7 (0.5 to 0.8) | 0.09% | -29.4 (-37.1 to -25.4) |
| Exposure to forces of nature | 0.1 (0.1 to 0.1) | 0.01% | -45.8 (-45.8 to -45.8) |
| Other unintentional injuries | 1.2 (1.2 to 1.3) | 0.16% | -25.8 (-27.6 to -23.8) |
| Self-harm and interpersonal violence | 17.1 (16.3 to 17.5) | 2.32% | -7.6 (-9.9 to -5.5) |
| Self-harm | 10.0 (9.4 to 10.3) | 1.36% | -14.8 (-18.0 to -12.6) |
| Self-harm by firearm | 0.8 (0.7 to 1.0) | 0.11% | -10.3 (-13.9 to -7.2) |
| Self-harm by other specified means | 9.2 (8.5 to 9.5) | 1.25% | -15.2 (-18.4 to -12.8) |
| Interpersonal violence | 5.2 (4.7 to 5.5) | 0.70% | -11.1 (-13.3 to -8.7) |
| Assault by firearm | 2.2 (1.9 to 2.4) | 0.30% | -3.6 (-6.5 to -0.5) |
| Assault by sharp object | 1.2 (0.9 to 1.4) | 0.16% | -22.3 (-25.6 to -17.6) |
| Assault by other means | 1.8 (1.6 to 2.1) | 0.24% | -11.5 (-15.4 to -7.6) |
| Conflict and terrorism | 1.7 (1.7 to 1.7) | 0.23% | 98.4 (98.4 to 98.5) |
| Executions and police conflict | 0.2 (0.2 to 0.2) | 0.03% | 172.4 (156.8 to 187.6) |
By lost years
| Cause of premature death | Person-years lost |
|---|---|
| Cancer | 8,628,000 person-years |
| Heart disease and strokes | 8,760,000 person-years |
| Accidents and other injuries | 5,873,000 person-years |
| All other causes | 13,649,000 person-years |
| Cause of premature death | Person-years lost |
|---|---|
| (Use/Accessibility/... of) firearms | 1.42 million[6][7] |
| Motor vehicle crashes | 1.34 million[7] |
| All other causes |
Underlying causes
Malnutrition
Malnutrition can be identified as an underlying cause for shortened life.[9] 70% of childhood deaths (age 0–4) are reportedly due to diarrheal illness, acute respiratory infection, malaria and immunizable disease. However 56% of these childhood deaths can be attributed to the effects of malnutrition as an underlying cause.[10] The effects of malnutrition include increased susceptibility to infection,[11] musculature wasting, skeletal deformities and neurologic development delays.[12] According to the World Health Organization, malnutrition is named as the biggest contributor to child mortality[13] with 36 million deaths in 2005 related to malnutrition.[14]
Air pollution
Overall, air pollution causes the deaths of around ca. 7 million people worldwide each year, and is the world's largest single environmental health risk, according to the WHO (2012) and the IEA (2016).[15][16][17]
The IEA notes that many of root causes and cures can be found in the energy industry and suggests solutions such as retiring polluting coal-fired power plants and to establishing stricter standards for motor vehicles.[17] In September 2020 the European Environment Agency reported that environmental factors such as air pollution and heatwaves contributed to around 13% of all human deaths in EU countries in 2012 (~630,000).[18] A 2021 study using a high spatial resolution model and an updated concentration-response function finds that 10.2 million global excess deaths in 2012 and 8.7 million in 2018 – or a fifth – were due to air pollution generated by fossil fuel combustion, significantly higher than earlier estimates and with spatially subdivided mortality impacts.[19][20]
A 2020 study indicates that the global mean loss of life expectancy (LLE) from air pollution in 2015 was 2.9 years, substantially more than, for example, 0.3 years from all forms of direct violence, albeit a significant fraction of the LLE is considered to be unavoidable.[8]
Non-optimal ambient temperatures
A study found that 9.4% of global deaths between 2000 and 2019 – ~5 million annually – can be attributed to extreme temperature with cold-related ones making up the larger share and decreasing and heat-related ones making up ~0.91 % and increasing. Incidences of heart attacks, cardiac arrests and strokes increase under such conditions.[21][22]
Antimicrobial resistance
In a global assessment, scientists reported, based on medical records, that antibiotic resistance may have contributed to ~4.95 million (3.62–6.57) deaths in 2019, with 1.3 M directly attributed – the latter being more than deaths than from e.g. AIDS or Malaria,[23][24] despite being project to rise substantially.[25]
Aging
Traditionally aging is not considered as a cause of death. It is believed that there is always a more direct cause, and usually it is one of many age-related diseases. It is estimated that, as an root cause, the aging process underlies 2/3 of all death in the world (approximately 100,000 people per day in 2007). In highly developed countries this proportion can reach 90%.[26] There are requests of granting aging an official status of a disease and treating it directly (such as via dietary changes and senolytics).[27][28][29][30][31]
Developed vs. developing economies
Top causes of death, according to the World Health Organization report for the calendar year 2001:[32]
| Causes of death in developing countries | Number of deaths | Causes of death in developed countries | Number of deaths |
|---|---|---|---|
| HIV-AIDS | 2,678,000 | Ischaemic heart disease | 3,512,000 |
| Lower respiratory infections | 2,643,000 | Cerebrovascular disease | 3,346,000 |
| Ischaemic heart disease | 2,484,000 | Chronic obstructive pulmonary disease | 1,829,000 |
| Diarrhea | 1,793,000 | Lower respiratory infections | 1,180,000 |
| Cerebrovascular disease | 1,381,000 | Lung cancer | 938,000 |
| Childhood diseases | 1,217,000 | Car crash | 669,000 |
| Malaria | 1,103,000 | Stomach cancer | 657,000 |
| Tuberculosis | 1,021,000 | Hypertensive heart disease | 635,000 |
| Chronic obstructive pulmonary disease | 748,000 | Tuberculosis | 571,000 |
| Measles | 674,000 | Suicide | 499,000 |
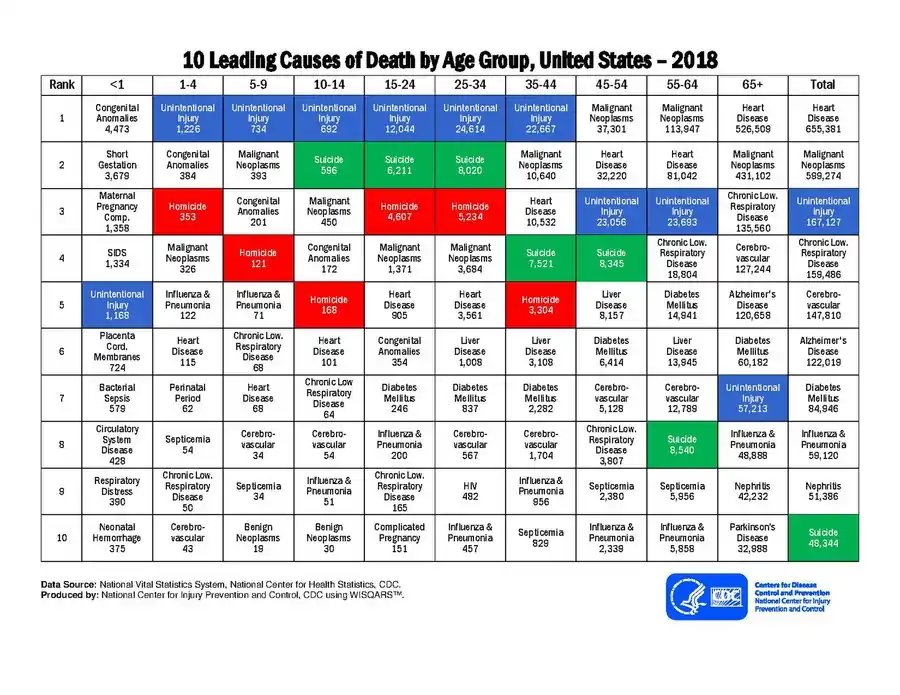
By age group (in the United States)

.png.webp)

By occupation
With an average of 123.6 deaths per 100,000 from 2003 through 2010 the most dangerous occupation in the United States is the cell tower construction industry.[35]

See also
- Capital punishment by country
- Epidemiology of suicide
- List of countries by intentional homicide rate
- List of killings by law enforcement officers by countries
- List of sovereign states and dependent territories by mortality rate
- List of terrorist incidents
- List of unusual deaths
- List of wars and anthropogenic disasters by death toll (with links to many by-country and by-type detail lists)
- Preventable causes of death
- Medical error
References
- WHO (2005). "Cancer". Archived from the original on May 18, 2020.
- Lozano, Rafael; et al. (Dec 2012). "Global and regional mortality from 235 causes of death for 20 age groups in 1990 and 2010: a systematic analysis for the Global Burden of Disease Study 2010" (PDF). Lancet. 380 (9859): 2095–128. doi:10.1016/S0140-6736(12)61728-0. hdl:10536/DRO/DU:30050819. PMID 23245604. S2CID 1541253. Archived from the original (PDF) on February 11, 2020.
- World Health Organization, "The top 10 causes of death"
- GBD 2017 Causes of Death Collaborators. "Global, regional, and national age-sex-specific mortality for 282 causes of death in 195 countries and territories, 1980–2017: a systematic analysis for the Global Burden of Disease Study 2017". The Lancet. 8 Nov 2018; 392:1736–88. doi:10.1016/S0140-6736(18)32203-7. Table 1.
- National Cancer Institute. "Person-Years of Life Lost". Cancer Trends Progress Report, 2009/2010 Update. Archived from the original on July 1, 2011.
- "Premature deaths from guns expose another toll of the firearms crisis". Georgia Public Broadcasting. Retrieved 16 March 2022.
- Klein, Joshua; Prabhakaran, Kartik; Latifi, Rifat; Rhee, Peter (1 February 2022). "Firearms: the leading cause of years of potential life lost". Trauma Surgery & Acute Care Open. 7 (1): e000766. doi:10.1136/tsaco-2021-000766. ISSN 2397-5776.
- Lelieveld, Jos; Pozzer, Andrea; Pöschl, Ulrich; Fnais, Mohammed; Haines, Andy; Münzel, Thomas (1 September 2020). "Loss of life expectancy from air pollution compared to other risk factors: a worldwide perspective". Cardiovascular Research. 116 (11): 1910–1917. doi:10.1093/cvr/cvaa025. ISSN 0008-6363. PMC 7449554. PMID 32123898.
- "Mortality In Second And Third Degree Malnutrition". Tropej.oxfordjournals.org. 2014-06-03. Archived from the original on 2016-01-31. Retrieved 2014-06-09.
- Pelletier DL, Frongillo EA, Schroeder DG, Habicht JP (2014-01-24). "The effects of malnutrition on child mortality in developing countries". Bull. World Health Organ. 73 (4): 443–48. PMC 2486780. PMID 7554015.
- Faulk, W. Page; Demaeyer, E. M.; Davies, A. J. S. (1974-06-01). "Some effects of malnutrition on the immune response in man". The American Journal of Clinical Nutrition. Ajcn.nutrition.org. 27 (6): 638–646. doi:10.1093/ajcn/27.6.638. PMID 4208451. Retrieved 2014-06-09.
- Grover, Zubin; Ee, Looi C. (October 2009). "Elsevier". Pediatric Clinics. Pediatric.theclinics.com. 56 (5): 1055–1068. doi:10.1016/j.pcl.2009.07.001. PMID 19931063. Retrieved 2014-06-09.
- Stay informed today; every day (2008-01-24). "Malnutrition: The starvelings". The Economist. Retrieved 2014-06-09.
- Ziegler, Jean (2007). L'Empire de la honte. Fayard
- "7 million premature deaths annually linked to air pollution". WHO. 25 March 2014. Archived from the original on March 26, 2014. Retrieved 25 March 2014.
- "Energy and Air Pollution" (PDF). Iea.org. Archived from the original (PDF) on 11 October 2019. Retrieved 12 March 2019.
- "Study Links 6.5 Million Deaths Each Year to Air Pollution". The New York Times. 26 June 2016. Retrieved 27 June 2016.
- Abnett, Kate (8 September 2020). "One in eight deaths in Europe linked to pollution, environment, EU says". Reuters. Retrieved 9 October 2020.
- Green, Matthew (9 February 2021). "Fossil fuel pollution causes one in five premature deaths globally: study". Reuters. Retrieved 5 March 2021.
- Vohra, Karn; Vodonos, Alina; Schwartz, Joel; Marais, Eloise A.; Sulprizio, Melissa P.; Mickley, Loretta J. (1 April 2021). "Global mortality from outdoor fine particle pollution generated by fossil fuel combustion: Results from GEOS-Chem". Environmental Research. 195: 110754. Bibcode:2021ER....195k0754V. doi:10.1016/j.envres.2021.110754. ISSN 0013-9351. PMID 33577774. S2CID 231909881. Retrieved 5 March 2021.
- "Extreme temperatures kill 5 million people a year with heat-related deaths rising, study finds". The Guardian. 7 July 2021. Retrieved 14 August 2021.
- Zhao, Qi; et al. (1 July 2021). "Global, regional, and national burden of mortality associated with non-optimal ambient temperatures from 2000 to 2019: a three-stage modelling study". The Lancet Planetary Health. 5 (7): e415–e425. doi:10.1016/S2542-5196(21)00081-4. ISSN 2542-5196. PMID 34245712. S2CID 235791583.
- "Antibiotic resistance killed more people than malaria or AIDS in 2019". New Scientist. Retrieved 12 February 2022.
- Christopher JL Murray; et al. (12 February 2022). "Global burden of bacterial antimicrobial resistance in 2019: a systematic analysis". The Lancet. 399 (10325): 629–655. doi:10.1016/S0140-6736(21)02724-0. ISSN 0140-6736.
- Chanel S, Doherty B (2020-09-10). "'Superbugs' a far greater risk than Covid in Pacific, scientist warns". The Guardian. ISSN 0261-3077. Retrieved 2020-09-14.
- Aubrey D.N.J., de Grey (2007). "Life Span Extension Research and Public Debate: Societal Considerations" (PDF). Studies in Ethics, Law, and Technology. 1 (1, Article 5). CiteSeerX 10.1.1.395.745. doi:10.2202/1941-6008.1011. Archived from the original (PDF) on October 13, 2016. Retrieved August 7, 2011.
- Zhavoronkov, Alexander; Bhupinder, Bhullar (2015-10-04). "Classifying aging as a disease in the context of ICD-11". Frontiers in Genetics. 6: 326. doi:10.3389/fgene.2015.00326. PMC 4631811. PMID 26583032.
- Stambler, Ilia (2017-10-01). "Recognizing Degenerative Aging as a Treatable Medical Condition: Methodology and Policy". Aging and Disease. 8 (5): 583–589. doi:10.14336/AD.2017.0130. PMC 5614323. PMID 28966803.
- "Opening the door to treating ageing as a disease". The Lancet Diabetes & Endocrinology. 6 (8): 587. 2018-08-01. doi:10.1016/S2213-8587(18)30214-6. PMID 30053981.
- Calimport, Stuart; et al. (2019-10-01). "To help aging populations, classify organismal senescence". Science. 366 (6465): 576–578. Bibcode:2019Sci...366..576C. doi:10.1126/science.aay7319. PMC 7193988. PMID 31672885.
- Khaltourina, Daria; Matveyev, Yuri; Alekseev, Aleksey; Cortese, Franco; Ioviţă, Anca (July 2020). "Aging Fits the Disease Criteria of the International Classification of Diseases". Mechanisms of Ageing and Development. 189: 111230. doi:10.1016/j.mad.2020.111230. PMID 32251691. S2CID 214779653.
- "Cause of Death". UC Atlas of Global Inequality. University of California, Santa Cruz. 18 February 2004. Archived from the original on 18 June 2014. Retrieved 2014-06-09.
- "Leading causes of death by age group" (PDF). National Center for Injury Prevention and Control. 2018.
- "National Vital Statistics Report" (PDF). National Vital Statistics Report, Vol. 50, No. 15. September 16, 2002.
- Day, Ryan Knutson, Liz (21 May 2012). "Methodology: How We Calculated the Tower Industry Death Rate".
- "Bureau of Labor Statistics; National Census of Fatal Occupational Injuries in 2006" (PDF). Retrieved 2014-06-09.
External links
| In medicine |
| ||||||||||||
|---|---|---|---|---|---|---|---|---|---|---|---|---|---|
| Lists | |||||||||||||
| Mortality | |||||||||||||
| After death |
| ||||||||||||
| Paranormal |
| ||||||||||||
| Legal | |||||||||||||
| Fields | |||||||||||||
| Other |
| ||||||||||||
| |||||||||||||