Comments
ThoraciusAppotite t1_j8n0oz8 wrote
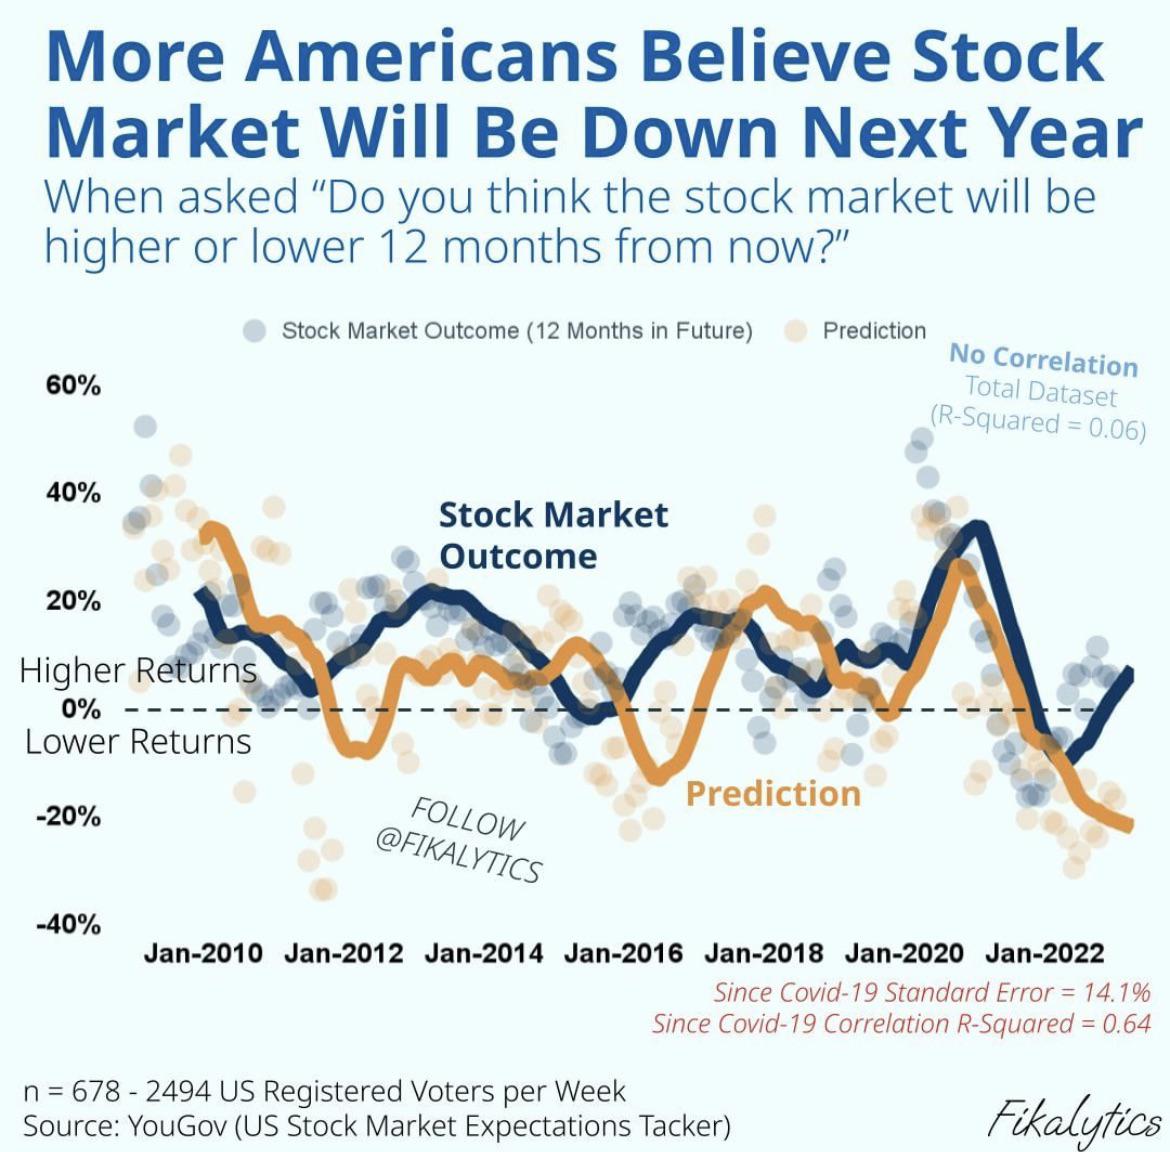
I'm confused what the difference between the blue line and the blue dots is.
As for your point though, see "probability matching"
mylarky t1_j8n8fo7 wrote
I think the lines are a filtered average?
Shellbyvillian t1_j8npblf wrote
Also, are the prediction results posted when the question was asked or when the prediction was based. I.e do I need to offset the prediction by 12 months to see if the prediction was accurate?
pheasant-plucker t1_j8nla0u wrote
You might still expect a correlation though. If the stock market is going to be a lot higher, you might expect that more people will say that it will be positive
[deleted] t1_j8n72gg wrote
[deleted]
satans_toast t1_j8mwztb wrote
When the market is down people think it will stay down. When the market is up people will think it'll stay up. Plot reality vs perception and I suspect that lag will be evident.
Jahoosawan t1_j8my054 wrote
90 degrees out of phase, the cosine to the Stock Market's sine.
DoubleDickel t1_j8mjine wrote
The only person less accurate in predicting stock prices than the average American is Jim Cramer.
Fantastic-Surprise98 t1_j8nfomg wrote
Bangs on a horn button
26Kermy t1_j8n05zw wrote
It looks like the majority of predictions through the years are people just believing the current trend will continue and then changing their opinion when the market changes.
PM-me-your-moods t1_j8p333y wrote
I don't think so. Consider that the prediction comes out well in advance of the actual market change. I think the behavior of investors is driven by the prediction which sets off a self-fulfilling prophecy.
Fuck_You_Andrew t1_j8mzgu9 wrote
I dont think there's anyone or thing in the world that can intelligently speak to the performance of the Stock Market 12 months out.
LatterNeighborhood58 t1_j8n9rxe wrote
It clearly looks like the predictions line is lagging and following the stock market line vs the other way around . The predictions seem to be of no value.
DrTonyTiger t1_j8nf1na wrote
The predictions seem to lag actual by half a year to a year. Good to know.
When the news reports say "analysts predict", I know how to value that information.
FrogCoastal t1_j8o2ff5 wrote
That figure tells me most Americans don’t know what they’re talking about when it comes to the stock market.
Square_Tea4916 OP t1_j8mizri wrote
Source: https://today.yougov.com/topics/economy/trackers/us-stock-market-expectations and Google Finance
Tool: Google Charts
pequenolocomono t1_j8n1z9x wrote
What are the dots vs the lines in this chart?
tsunamisurfer t1_j8ot560 wrote
Shouldn't you have a measure of probability to say "no correlation" ? What if you are very certain (i.e. lots and lots of data) that there is a very small, but positive, correlation of 0.06? I've seen correlations of 0.001 that had a 95% confidence interval that did not include 0.
PredictorX1 t1_j8mq66l wrote
As an extension of this, it'd be interesting to see the cross-correlation for other offsets in which public sentiment precedes the stock market outcome.
the_humeister t1_j8nankg wrote
That's just the confirmation I need. All in 0 DTE SPY calls
isosceleswheel t1_j8norki wrote
This is only because of the nonstop news reporting in the coming “recession” that they are desperately trying to will into existence
giantjumangi t1_j8npjnh wrote
"Be Fearful When Others Are Greedy and Greedy When Others Are Fearful"
soundadvices t1_j8ntf8n wrote
If you're wondering if it go up or down, the answer is always yes.
case_on_point t1_j8o12nl wrote
Total dataset r-squared = .06
[deleted] t1_j8mjedr wrote
[removed]
EmperorMajorian t1_j8nwagk wrote
Great news, market usually does the opposite of what people expect
[deleted] t1_j8o26s0 wrote
[removed]
vortexminion t1_j8omokb wrote
Kinda looks like people are like "it's down now, so it'll not changw in 12 months" most of the time. Like, most of graph is offset by 12 months...so people are just persistence forecasting on average when asked (or the average of the extreme predictions is persistence)
burns_after_reading t1_j8ovwcs wrote
It's interesting that at a glance, the predictions seem not far off. But in reality, the predictions are just lagging behind market results by a few days which makes them absolutely useless.
apetnameddingbat t1_j8p7rav wrote
I'd imagine this is highly correlated to the fear index.
rev_daydreamr t1_j8pazm8 wrote
Are the returns stationary on this timeframe? When dealing with time series, especially non stationary ones, you should really be looking at their first (and potentially higher) order differences when computing correlations or R^2.
luishacm t1_j8pbv86 wrote
They are lagged a lot, most of them would lose tons of money.
[deleted] t1_j8pzgor wrote
[removed]
Strong_Substance3790 t1_j8q31pu wrote
The Forecasters Hall of Fame has no members.
Significant-Ideal-18 t1_j8nk0c4 wrote
Which now sets the stage for the market to actually go down 🤦🏻♀️

sickagail t1_j8mxavd wrote
I'm a little confused.
The question asked is "will the market be higher or lower 12 months from now." But the plotted line seems to be a percentage change in the market, not a yes or no answer.
I'm guessing the prediction is something like "higher" answers minus "lower" answers. But a bunch of people saying "higher" is different from a bunch of people saying "30% higher."