Submitted by sometiara1 t3_113mvpx in dataisbeautiful
Submitted by sometiara1 t3_113mvpx in dataisbeautiful
The graph makes it look like they put more plastic in the oceans than they produce. Are they dumping trash for other countries?
Yup, they import a lot of plastic goods. China and the US produce most of the plastic in the world but most of it is not disposed of in those countries, its exported.
Those plastics are mostly exported as part of products, not waste.
Correct, the US/China export goods and they get disposed of in other countries.
Not sure how that was unclear.
Sort of, they're exported mostly as packaging and other short term uses. I keep track of my plastic waste and it's at least 90% packaging, if not more, and that's with me being conscious and trying to reduce it.
>Those plastics are mostly exported as part of products
Which eventually becomes...
> China and the US.
Not exactly. China, then Germany, then the US. But China produces more than the US, Germany, Italy, France, Poland, Netherlands, and Japan combined. Below are the 15 countries that exported the highest dollar value worth of plastic items during 2021.
China: US$35.5 billion (34.3% of exported plastic items)
Germany: $11.4 billion (11%)
United States: $7.8 billion (7.5%)
Italy: $3.7 billion (3.5%)
France: $3.4 billion (3.3%)
Poland: $3.1 billion (3%)
Netherlands: $2.77 billion (2.7%)
Japan: $2.4 billion (2.3%)
Mexico: $2.3 billion (2.2%)
Czech Republic: $2.18 billion (2.1%)
Taiwan: $2.13 billion (2.1%)
Hong Kong: $1.9 billion (1.8%)
South Korea: $1.73 billion (1.7%)
Belgium: $1.69 billion (1.6%)
Vietnam: $1.63 billion (1.6%)
https://www.worldstopexports.com/plastic-item-exports-country/
That's value, not tons
I think we can assume tonnage directly correlates to value, so much so that the positions of countries would very closely mirror the order above. Of course if you have source for tonnage, why not share it?
You're misreading it. The total plastic waste circle and the plastic waste into oceans circle have different scales, so even though the total plastic waste circle is smaller for the philippines, it's still about 1 million tonnes while the plastic waste into oceans circle is amount 500k tonnes.
They do import waste. That's true. But a lot of locals have zero environmental awareness and treat the ocean as a garbage can.
it's always important to educate those with little awareness! only way we can make an impact
And having been born in a place that a system they do not control has decided is the world's plastic dump might have something to do with that?
Hard to blame the locals lack of environmental awareness when the evidence of global systemic failure is staring you in the face but you managed lol
This.
Rich countries with their more advanced tech can't recycle their own shit so they send it to poor countries, then pretend they're clean and make charts like this.
Recycling is pretty much a scam outside of metals.
Regions mainly trade waste within regions. The Philippines waste is mainly from Asian countries such as Japan.
Is the Philippines forced to take anyone else's trash, though?
No, they do it because there's money to be made from it. In a sense, you could say they're forced into it by the global economy, although it's more like an emergent behavior in response to economic factors rather than true coercion.
This seems like an issue with their government then.
And the governments of all the countries that export their plastics with full knowledge they're ending up in the ocean
I'm not absolving them, but plenty of nations get trash and it doesn't end up in the ocean to anywhere near the degree that it does in the Philippines. So they should be taking only what they can actually process. Again, they're under no obligation to take anything at all.
People had low awareness prior to trash being imported, and thus I don't see a cause and effect relationship there. In addition, the level of waste differs widely by island and village. The variation in regulations and education likely play a large role.
They also import a shitton of our "recycling" too. Which is then driven out into the country side and burnt on the side of the road.
Because it's cheaper than actually sorting and recycling it.
It's important to note also that very small island nations cannot have large scale landfills or recycling plants for obvious reasons. They have to ship their waste off island, this is expensive, pretty obvious why people dump a lot in the ocean
[removed]
American trash, international rash.
That's so sad. Felt heartbroken to hear about that kind of scenario, poor aquatic animals.
Phillipines WTF?
Also it's nice to see a graphic where India can't be spotted as one of the bigger spikes.
I think the chart could be clearer about the fact that the majority of plastic waste emitted to the ocean by the Philippines is shipped there by wealthy countries' rotten "recycling" schemes. The Philippines itself is one of the smaller producers of plastic waste.
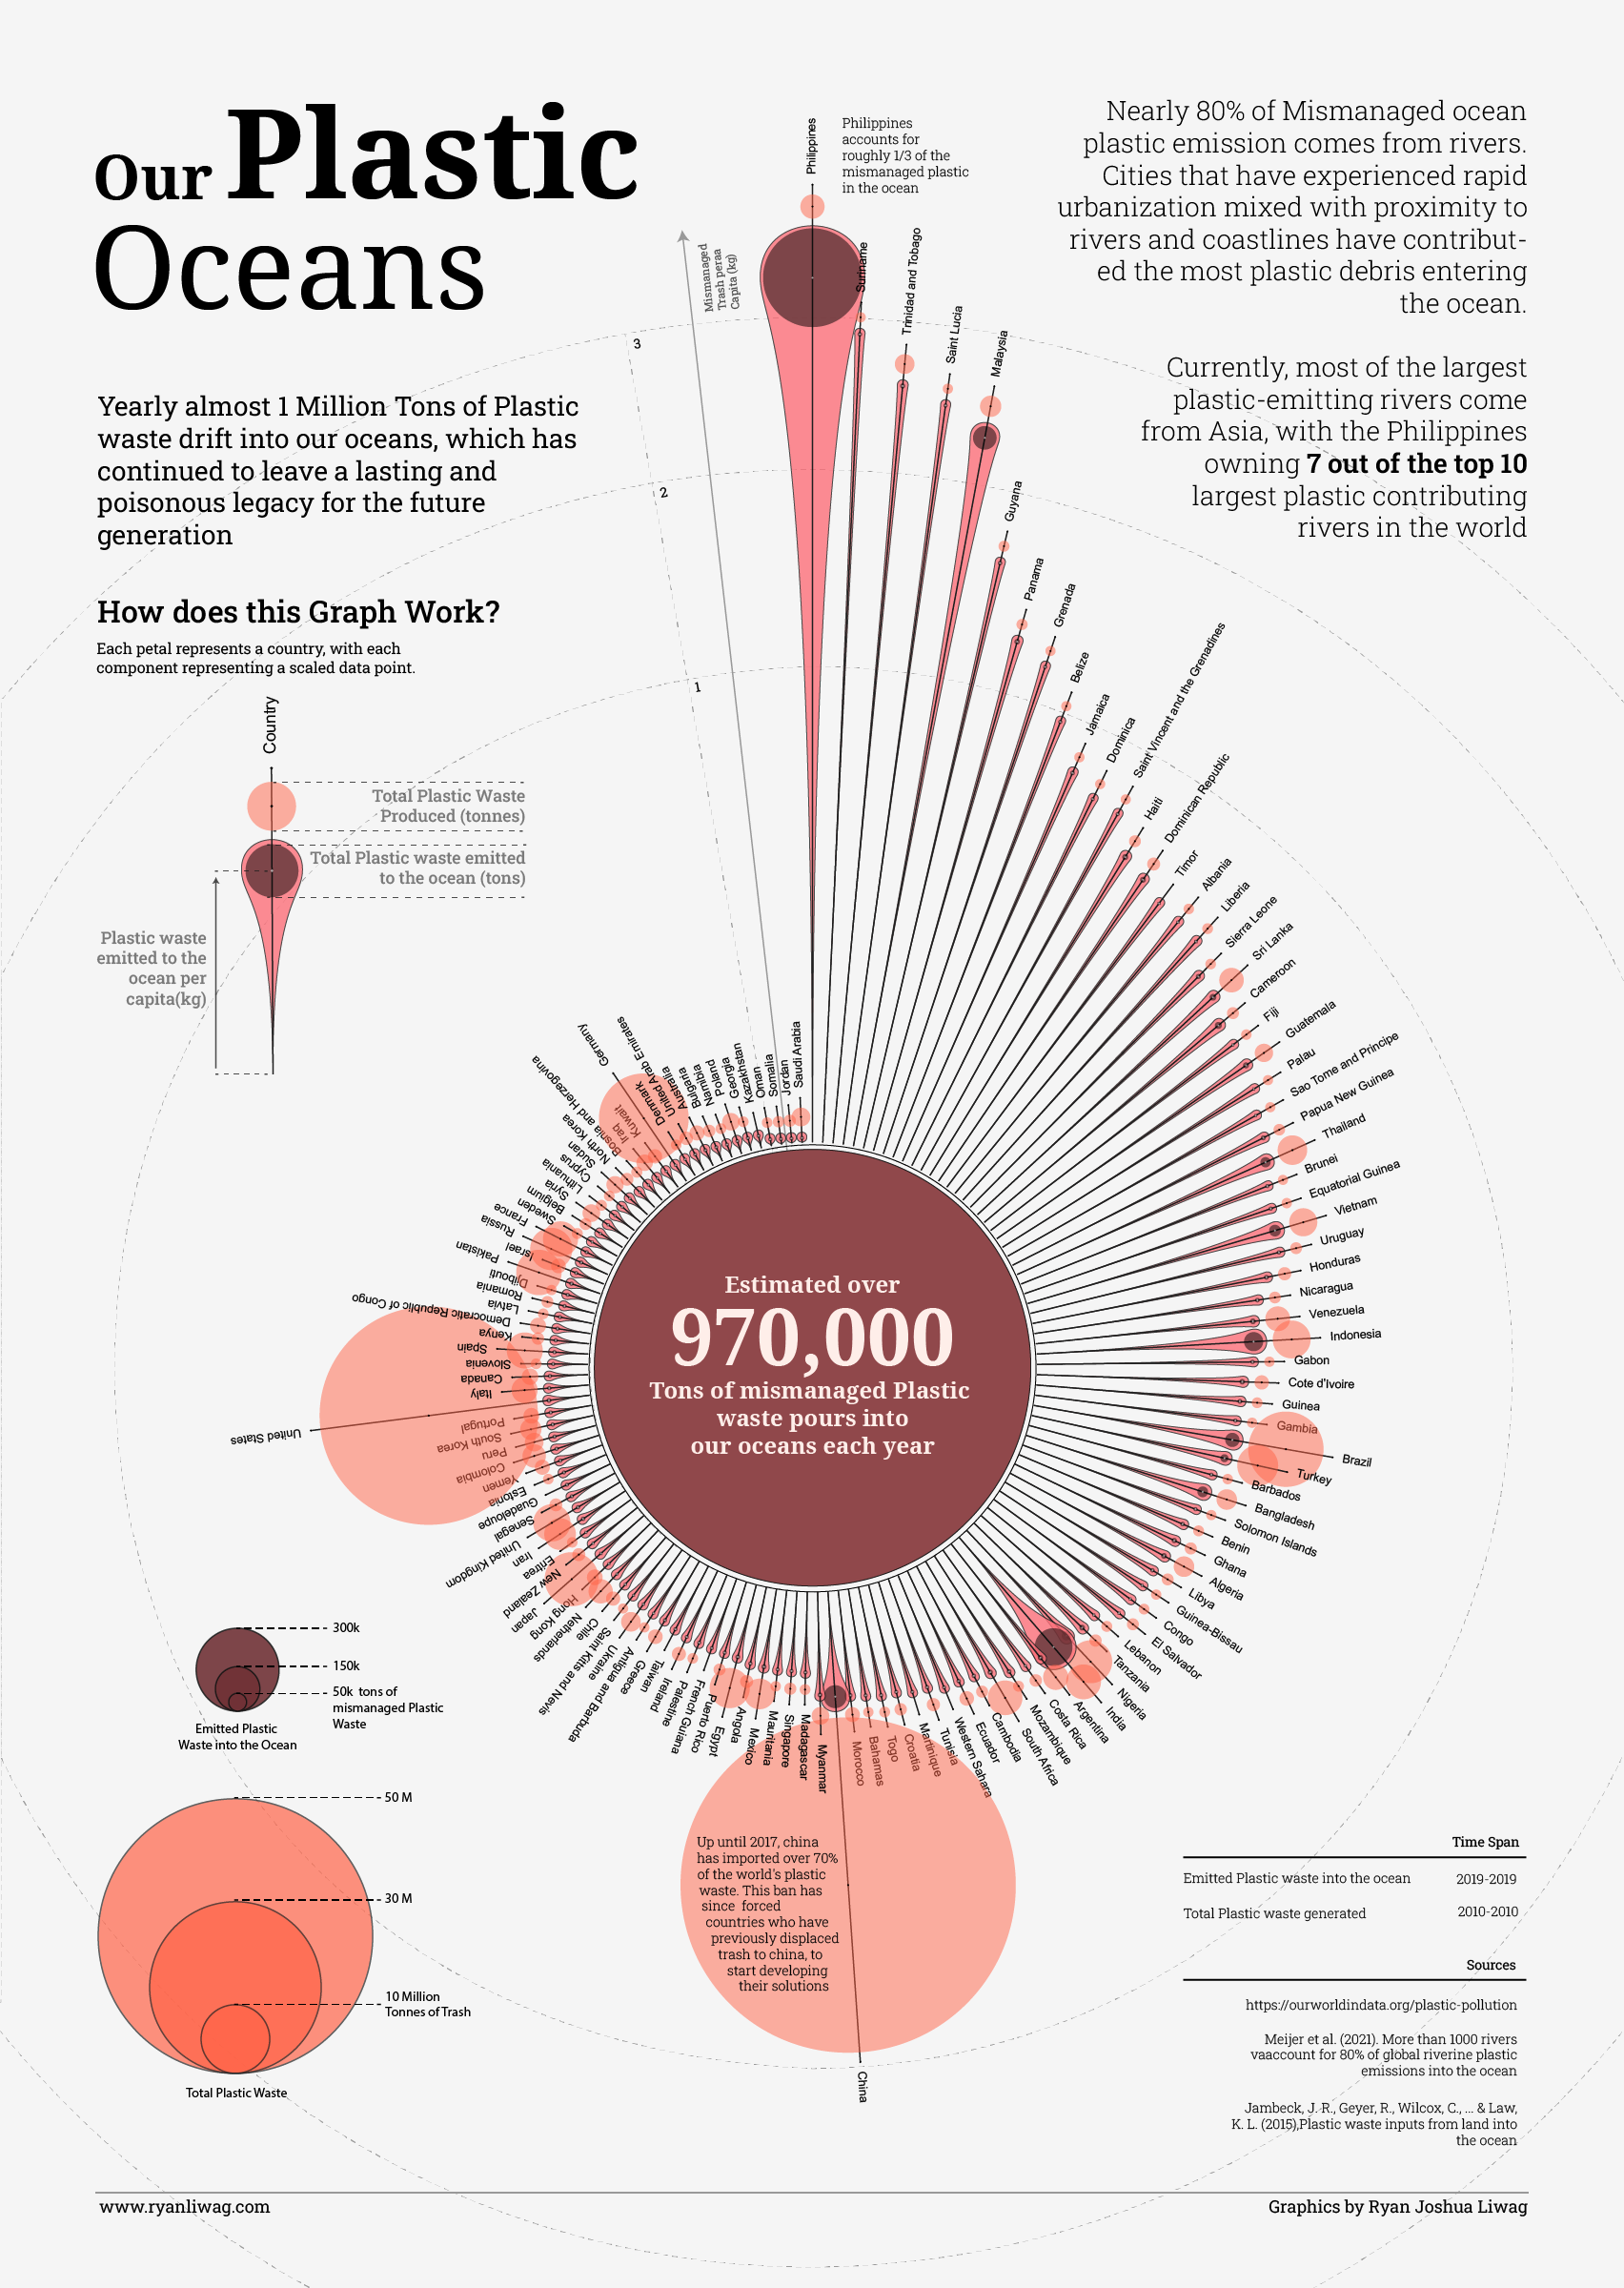
You can see a much smaller circle showing the Philippines plastic waste production, and the much larger circle showing their plastic waste emission.
I know they stopped accepting Canadian plastic waste (I agree on recycling being mostly a scheme), but I have no idea what the Philippines' planned to do with the plastic waste.
Wouldn't Canada be able to bury non biodegradable plastics somewhere in the uninhabitable Canadian Shield. Maybe I should take out a billion dollar loan to start a company that imports and indefinitely buries international plastic waste? N/m back to Reddit.
There are different scales between the two different coloured circles. They do not appear to be directly comparable in size. Philippines has been rated as highest per capita emitter of mismanaged plastic. Presumably this relates in part to it's geography, lots of rivers, lots of coastline vs land mass.
Yep - I made the 101 error of not checking the scales!
Presumably they are paid for this recycling they're meant to be doing? Where's that money going? Not into the rivers with the water clearly.
Doesn't work like that, these are plastics that are badly classified and dirty. Classifying and recycling them in developed countries is not economically viable, but with cheap labor from poor countries it is, so they buy them for nearly nothing, and they process them.
Thing is, most of it is not useful, so all of that unusable, unrecyclable plastic ends un in a poor country without the means to get rid of it. China used to do this until they banned the import of those plastics because the impact on people's health was more expensive to treat than the economic margin, and now it's done in SE Asia.
So, the blame is on developed countries for producing an incredible amount of unrecyclable plastics and shipping it there, not on poor people trying to make a living out of recycling it.
Canada's more advanced tech can't recycle their own shit, then they pay peanuts to poor countries to take their trash so they can appear good in charts like this.
What a joke.
Less than 2% of waste is traded internationally, the blame is still on undeveloped countries that just use the ocean as a dump
Percentage vs raw numbers. Interesting argumentative decision given that the raw numbers and their visual representation in this graph is bare for all to see.
Edit: I assume this is your source for that 2%
https://ourworldindata.org/plastic-waste-trade
While the article is indeed well researched, it doesn't address where the plastics in the ocean were produced. It only talked about total plastic pollution, which is not what the discussion is about.
I mean if you look at one of the graphs there, Europe, Japan, and North America still ship more than 4M tonnes of plastic to Asian countries.
https://ourworldindata.org/uploads/2022/10/Plastic-waste-trade-sankey-1536x1175.png
The 970k tonnes fits very well inside that 4M tonnes.
Less than 2% of waste is traded internationally, the blame is still on undeveloped countries that just use the ocean as a dump
>Most plastic waste is traded within world regions, rather than between them
>Where does plastic waste flow across the world?
>Europe is the region that exports the most plastic, but it’s also the region that imports the most.
>This is true more generally. Most plastic is traded within a given region. European countries export most plastic to other European countries. Asian countries export most to other Asian countries.
>In the visualization, we see the flow of plastic across the world. On the left we have the exporters of plastic waste; on the right, we see where that plastic ends up. The height of each bar is proportional to the amount of plastic that is traded.
>Europe is the biggest exporter of plastic. But, it’s also the biggest importer. Many countries across Europe trade with one another. At the national level, Germany is the biggest exporter and importer – it trades different plastics with its neighbors including the Netherlands, Poland, Austria, and Switzerland.
>This is also true of Asia, where Japan is the biggest exporter to other countries in Asia.
India is easily spotted as the second biggest in total waste put in ocean (size of the dark red ball) but because of its massive population it is lower per capita (height of the spike) kind of a confusing infographic, but interesting data.
[removed]
It doesn’t look good for India. Light pink circle shows how much plastic is produced by the country. Dark pink circle shows how much mismanaged plastic waste is released into the ocean.
This chart is both beautiful and ugly. Beautiful in presentation (long time I haven't seen such beauty) Ugly in conclusions. The only good for me is that my country is one on the bottom line (PL).
First time making anything like this, so any feedback is welcome :)
Note: I took some creative liberties with the scaling (each stem is square root scaled) to try and make the visualization more appealing but yea it does suffer readability.
Maybe it's just me but I think when using 2d shapes, the area of the shape is more intuitive at communicating the data than the diameter/length. Here a country with 5 times more output look like it's 25 times more by area.
Interesting stuff though, thanks!
Adding to this, if you’re not scaling for area, a line/bar would make more sense. For this chart, the circle (scaled properly for area) seems like the right choice.
Reading a lot of the names is hard since half of them are upside down. I also have to really zoom in to be able to read any of the countries, which isn't great design either. I would rather have maybe just the top 20, plus a few additional notable countries with a large population.
Also, the total plastic waste is hard to compare across countries given the circular nature of the presentation which is compounded by using the area of a circle to show total volume, so it just clutters up space without really adding much in my opinion.
​
From a distance though, and without trying to really get any information from the plot, it is very pretty!
Love this visualization. However for a few of the data points, including the Philippines, seems like they are emitting more waste than they produce. Is that because other countries are exporting trash for them to then negligently dispose of?
Yes, probably. We (EU in my case) export a lot of our waste to SE Asia. Would be nice to have data accounting for exports.
Looks like OP answered a different comment thread. The emission and generation are from different time periods (as per the bottom right corner) so while it is a cool visualization, it's hard to draw definitive conclusions about whether trash is being exported.
Do you have data proportional to the population too?
The link lists that 80% of ocean plastics is land-based, I’m assuming river based plastics are considered land-based. Is that correct?
Can you flip the country names when they are completely upside down?
Are the tools free to use?
Good job of conveying multiple metrics on a single chart (total plastic waste vs waste in ocean vs per capita). Once you take the time to understand the chart, you can visually compare different countries in multiple dimensions at the same time.
The circular/spiral arrangement works well for this data, for two reasons: If it were a bar chart, you'd have to scroll back and forth to compare countries, rather than seeing them all at the same time (I hate scrolling back and forth!). Plus, the arrangement gives more space on the outside of the circle to fit the occasional large data points such as the US, China,...That would be harder to read in a linear format. Good choice!
However, the way circles represent the values is misleading -- the value should correspond to the area of the circle, not the diameter.
Also, according to the discussions in this post, it seems the data itself is misleading -- not taking into account the originating source of plastic waste, which ends up being quite significant.This is an issue with the data that was selected for the chart, not an issue with the visualization. (I doubt that there's accurate or comprehensive data available for country of origin.)
Overall, I learned quite a bit that I hadn't known previously.
OP, this is a really beautiful chart. Did you produce it? Can you give some insight into why the chart presents plastic waste generated in 2010 with waste emitted in 2019? Is this a question of data availability?
The part that surprised me the most is why does Germany produce that much plastic waste? The UK and Japan comparatively produce a lot less and Japan is notorious for packaging literally everything in plastic.
Probably depends on the definition of waste. Maybe some industrial waste counts in here.
Why doesn't the orientation of the countries change clockwise past 6 o'clock? Very nice infographic, but /r/mildlyinfuriating design choice.
Is this based on local reporting or some common method? The difference between Philippines and Indonesia seems suspicious
Yeah. I think this research topic is still far from being settled. Just 5 years ago the understanding was that 10 rivers contributed almost all riverine plastic into the ocean but now the data is wildly different. It needs more research. My gut feeling is that Indonesia and China for example are underestimated.
And greater Jakarta is home to over 25m people during weekdays
So Philippines imports plastic waste, then dumps it into its rivers?
The representation is interesting, but the chart is a nightmare to read.
Maybe flags or shorter country names with the same alignment? Or maybe a sequential numbering of the bubbles and a legend linking the numbers to the countries? Might significantly improve readability while retaining the aesthetics of the representation.
Also what's up with the date ranges?
The two circle colors aren't on the same scale, so no importing is needed to explain the Philippines
Ah. Ok, now that makes sense. Thanks.
What's the highest ranked country with no coastline? Sorry I'm not great with geography.
Land-locked countries do not make it onto the graphic. Think they all count as releasing no waste into the oceans.
I mean, they probably do it but not directly.
As far as I could see the only country on the list with no coastline on an ocean, is Kazakhstan at 5th last. There are a number of countries with short or very short coastlines relative to their size though, such as Bosnia and Herzegovina, Slovenia, Iraq and Democratic Republic of the Congo.
If you're actually able to interpret this graph, you'll the US is a huge producer of plastics, but has one of the smallest absolute emissions, and among the very lowest emissions relative to production.
All of which makes the ban on plastic straws even more idiotic.
They simply ship their plastics to the Philippines who then dump it. Bans make perfectly good sense, since they reduce the plastic shipped abroad and then subsequently dumped.
A small percentage is exported (less than 6% in 2021). Most of it goes into landfills.
That would still be more than like half the whole countries on here
I don't understand what you mean. What would be more than half? Half of what exactly?
Pick a random country off the list. There's at least a 50% chance, eyeballing it, that their total plastic produced there is < 6% of the United States' plastic. And that's pretending they are themselves dumping all of theirs too, so actually way more than that, probably like 80+% chance the US is dumping more, when you account for a lot of these other countries also using landfills.
The US certainly generates far more than its fair share of plastic waste, but you're calling it dumping as though we are forcing other countries to take it. I don't think it's ethical to send plastic waste to these countries when its known that it will be mismanaged, but these countries are also responsible for managing the waste they choose to import.
What this data primarily communicates is where waste management infrastructure and policy is probably lacking, rather than who is ultimately the most responsible for plastic waste in the oceans. The US is terrible when it comes to creating waste, but we also have more effective systems of disposal. My point being that the US isn't lower on the list when it comes to plastic mismanagement per capita because we ship it elsewhere. If that 6% didn't go to other countries it would go into landfills.
I don't disagree both countries sending and receiving are to blame, but the original comment was about how plastic laws in the US are "idiotic" because of a perception of low US waste being dumped.
Yet the US waste that ends up being dumped is on the very high end, because even if a minority gets dumped, it produces so much overall than a minority still dwarfs other countries. So those laws are not, in fact, "idiotic".
Another interesting view would be an xy diagram with amount vs coastline length
One of the biggest sources is the fishing industry. I don't know how you'd track the origins of that waste
So none of my plastic straws make it to the ocean but I still have to use paper straws that make my drink taste like I am consuming it through a rolled up newspaper.
Whaaat?! Also this graph is dope
Since this reddit doesnt really allows questions, maybe op/someone can answer me here:
How do you do such beautiful graphics?
Like i would be able to do everything by hand but i assume there is some sort of automation process?
I just got into this in school as a media designer but we only learned the different types of infographics and how to do the basics with excel/ai...
Wow, a plot that doesn't show America as the worst country in the world for once.
I wonder if Philippines is also the largest importer of the US trash.
Nice graph, now would be interesting which companys are responcible for the emitted waste per country. Yes ppl leave much waste too, but the industrial can be regulated if the politics wouldn't be corrupt.
Looks like 95% of ocean plastic is from South East Asia.
I like how China has a reason and the US has nothing.
Interesting data but why did you ruin the presentation by putting it in a circle and making it really difficult to read half the entries?
A simple bar chart would be more informative. Put it on a log scale if there is a wide range.
[removed]
[removed]
Really nice looking data display, thank you
[removed]
[removed]
Da fuq are the dudes in Trinidad getting up to ?!
[removed]
[removed]
[removed]
[removed]
Wtf is this graph how is this beautiful
Have you ever heart a parent saying their kid is ugly? Why would the op admit that this diagram is ugly and useless?
[removed]
You can find something imperfect about any visualization (especially one that encompasses so many different measures) but damn it's refreshing to see something here that looks good and is reasonably informative
What does it look like if you took both stats from the same year?
I see Plastic Generated was taken from 2010 and Chucked into the Ocean was from 2019.
I can't speak for anywhere else but around 2014/15 the UK started charging for and phasing out single-use plastic bags for things like shopping and groceries. I'd quite like to see how it would differ over those 9 years.
[deleted]
No! I hate American straws and nobody is going to make me like them.
United Kingdom..do better. We shouldn't even be on this list.
But how beautiful is the infographic!
Where are the international sea spills? A lot of plastic is simply old nets from fisher ships or spills from container ships.
Australia has less plastic in the ocean than some landlocked countries, but we still only have paper straws
These countries need to come together and ban single use plastics. Tell these corporations NO.
Great job! I really wish people showed how they made these wonderful data visualizations! I really want to learn :(
Does this have anything to do with the Philippines accepting "recycling" from other countries like the US? As in, the recycling loads that places like the US are too lazy and cheap to recycle themselves and ship to poorer countries instead?
I'm a little suspicious that the data oversimplifies the picture, and I'd be very interested in what it would look like if the country of origin was verified...
sorry to burst your bubble but this data is dated 2019
The global consumption of single-use plastics has increased by up to 300% since the pandemic, according to a 2021 Organisation for Economic Co-operation and Development report
An estimated 1.6 billion disposable masks wound up in the ocean in 2020 alone, creating a vast pile of floating plastic waste and threatening marine life across the planet.
Researchers from Visual Capitalist found that 3 per cent of the 52 billion disposable single-use masks produced to curb the Covid-19 pandemic found their way into the sea.
The throwaway masks sent 5500 metric tonnes of plastic into the oceans, which will take up to 450 years to biodegrade, the group said.
in 2021 University of Southern Denmark reported:
Recent studies estimate that we use an astounding 129 billion face masks globally every month -- that is 3 million a minute. Most of them are disposable face masks made from plastic microfibers.
[deleted]
what an awesome infographic poster mr ryan liwag!
worth a visit https://www.ryanliwag.com/
A new paradigm, earth + plastic.
Isnt there like a bacteria enzime in the works that will process the plastic?
[removed]
Poor Austria, either hasn’t discovered plastic or was forgotten by the data scientists that made this map
What a great graph for making big rich countries feel good. The "per capita" calculation gives a wildly misleading idea of who should be acting to stop plastic pollution. A lot of the countries with the longest petals are just very small.
Well done North Korea! clap clap
Pretty surprised by the position of FRANCE knowing that France has the largest exclusive economic zone of the world.
But I thing its territory have been divided in this graf. "French Guiana", "Guadeloupe", ...
What the fuck are we going to do about this plastic situation
Ofcourse my country is number 1 😢😢
Well the graph can sadly not Display how much ofnthe plastic waste from industrialised countries get dumped in the ocean with s poor country as a proxy.
Fake news! We all know America is the worst ever at everything.
No, I live in Europe and we are constantly bombed with news about how much we pollute the fucking world but no single word about Asia or billionaires. So we are the worst and you are second after us because America is sometimes mentioned.
The length of the petals is ocean waste per capita. The size of the circles is total.
The US has extensive anti-littering campaigns so the vast majority of our waste never touches an ocean.
They still are, they simply ship their plastic to the Philippines who then dump it. Where do you think the Philippines is getting like 20x more plastic than they themselves produce to dump?
Ah, it's rewarding to see a graph where we're not the monsters for a change.
A lot of the plastic going into the ocean from Asia was shipped there from the U.S. Necessarily, since the amount produced in the worst datapoint here (Philippines) isn't even as high as what they dump
That's fair, ive misread the graphic.
Ah well skunked again.
So why we have stupid paper items instead of plastic in Europe when the problem is actually in Asia? Let's ban knives in Germany because someone in Brazil got stabbed!
The problem with plastic is not exclusively ocean-trash related
A lot of the plastic "from Asia" is shipped there from the West because they don't know what to do with it, then the people they ship it to in Asia sometimes dump it in the ocean. So a lot of that is functionally still from the West
Actually a lot of recycable materials from Western Europe is processed in Eastern countries of the European Union like Poland.
Time to cancel the Philippines.
So essentially a handful of mostly rich countries generate a ton of plastic waste, then they ship it to SE Asia where it gets dumped into the ocean
Stupidity abounds and will be our downfall. Let's just sweep our trash under the rug (sell to 3rd world countries) and wash our hands of any responsibility.
Are not many of these countries with the highest amount also the dumping ground of plastic waste by 1st world countries.
As a Canadian I will say that we are probably a reason for Indonesia issue with plastic
And remember the garbage fiasco Where Canada sent some containers of recyclables to the Philippines and found out that they shipped pure garbage, and Canada initially does not want it back?
Yes honestly in the 10 most worst things canadas done
Expected the United States to be #1 but pleasantly surprised to see we only got Bronze.
Remember many countries import their waste to the Philippines. They are buried in global waste, and the should be receiving aid to help manage it.
If they can't handle it, why are they taking it? Even if the problem is the Philippines taking in the world's garbage, the problem remains that they're mishandling what they're taking in. They can say no and make other countries handle their own trash, so I'm guessing the government likes the cash more than they like a healthy environment for its citizens, let alone the ocean.
It's all involved parties' fault, since the sellers obviously know what's going on too.
But why buy someone else's garbage in the first place if there is no real infrastructure in place to handle it properly? If they're overwhelmed, they could say no more at any time.
Why SELL your garbage if there's no infrastructure to handle it properly?
There's no responsible answer to either question. Thus, they are BOTH to blame. Note that "both" is not saying the Philippines have no blame...
Why is it the responsibility of other nations to make sure that the Philippines can handle the amount of trash they're taking? That makes no sense. Sure, countries should handle their own waste issues, but no one is forcing the Philippines to take anyone's trash. They're doing so freely, and then immediately mismanaging it. It's a self-inflicted wound, and no doubt people in government or business are getting plenty of money out of it while the average person wades in garbage.
It's everyone's responsibility in the transaction, since they all obviously know what's going on. Nobody can ethically be involved in a dangerous or harmful activity they know about.
Similarly to how hiring a hitman is illegal... not just being a hitman. Both.
If I legally sell a gun to someone, it's not my responsibility if the buyer then shoots themselves in the foot with it. That's now how responsibility works.
Your comparison is silly because contract killing is illegal. Selling garbage isn't.
If you KNEW ahead of time, yes it absolutely would be. "Hey you I plan on playing a fun game with mygun whete I shoot the ground between my toes" "okay here you go" lol yes obviously you share blame.
That the Philippines dumps plastic in the ocean is so well known that we are posting it on reddit without even working in the industry, obviously industry people knew this, so yes therefore they fully share the blame.
Again same as hiring a hitman, same as trafficking guns to terrorists, same as selling unregistered people barrels of pseudoephedrine, etc
> Your comparison is silly because contract killing is illegal. Selling garbage isn't.
Your morality is entirely based on what the government tells you is good or bad? YIKES
Welp. I know my own country shipped boat loads there even after the Philippine government said not to.
https://en.m.wikipedia.org/wiki/Canada%E2%80%93Philippines_waste_dispute
It seems they only said not to after it was already sent and discovered the sending company had lied about the contents. It's still a problem with the local government, though. They take in far too much than they can handle, and it seems that most of the so-called "recyclables" are simply dumped. At any time, though, they can end or drastically reduce trash imports officially. They have the autonomy to do so.
Your numbers are off. China is by far the largest source of mismanaged plastic waste. Exporting the trash to another country that mismanages the trash still counts as mismanagement by the host country that exports.
C’mon guys, this graph is total catfart since it should put North America as the number #1 polluter of oceans due to the unlimited supply of oily plastics since they ship their garbage/trash to the Philippines and now the Philippines want to SEND it BACK! Going to be a shitty situation when all you see is garbage, garbage, garbage. Prepare a hole to burn and get some gas masks for the rest of your life cause things will get worse before you realize.
silentorange813 t1_j8rbx97 wrote
Can confirm that the Philippines has nightmarish levels of trash floating along the coast. The worst sighting was in eastern Mindanao where you couldn't see the water due to water bottles on the surface.