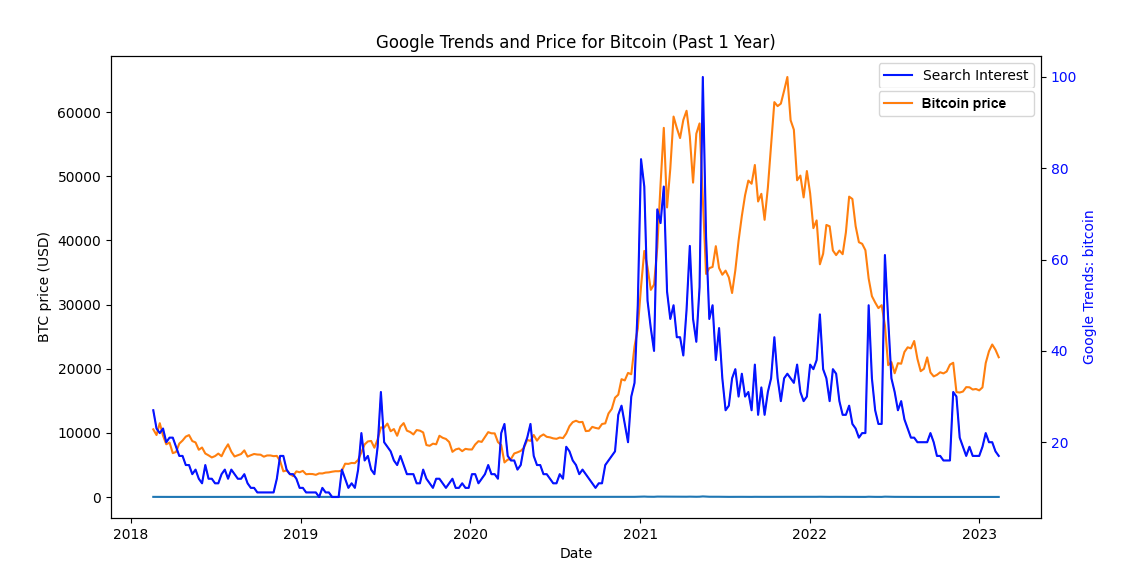
 [OC] Is Bitcoin price correlated with Google search volume or not?
Submitted by against_all_odds_ t3_114jf0g in dataisbeautiful
PandaMomentum t1_j8x22eo wrote
Scatterplot the two vars and do a Pearson's rho (on day z the price of bitcoin was $x and the search count on Google was y, for each day in T)
against_all_odds_ OP t1_j8x4pwb wrote
Thank you for the suggestion, but the intent was for users to visualize it in relation to actual BTC price.
hxckrt t1_j8yg6uj wrote
Naked caveman eyeballs are not that useful for answering how much they're correlated, and any follow-up questions like which one is leading. Do you know how to do statistical tests? If you do, why are you asking?
Parabola_Cunt t1_j8z7eay wrote
Tried to save this comment but it burned so badly it melted a hole in my pocket protector.
PETNman t1_j8zmagm wrote
Excuse me, but I rarely perform correlative analytics in the nude.
Viewing a single comment thread. View all comments