Submitted by Kraz_I t3_11nb4vq in dataisbeautiful
Submitted by Kraz_I t3_11nb4vq in dataisbeautiful
God (is not real) I love these posts, can't wait to read all the uneducated people talk about how education is for dumb people.
Does education or wealth have More impact I wonder?
What an interesting looking graph. I have never seen anything like it. It does not appear to be highly intuitive. Certainly, creative though!
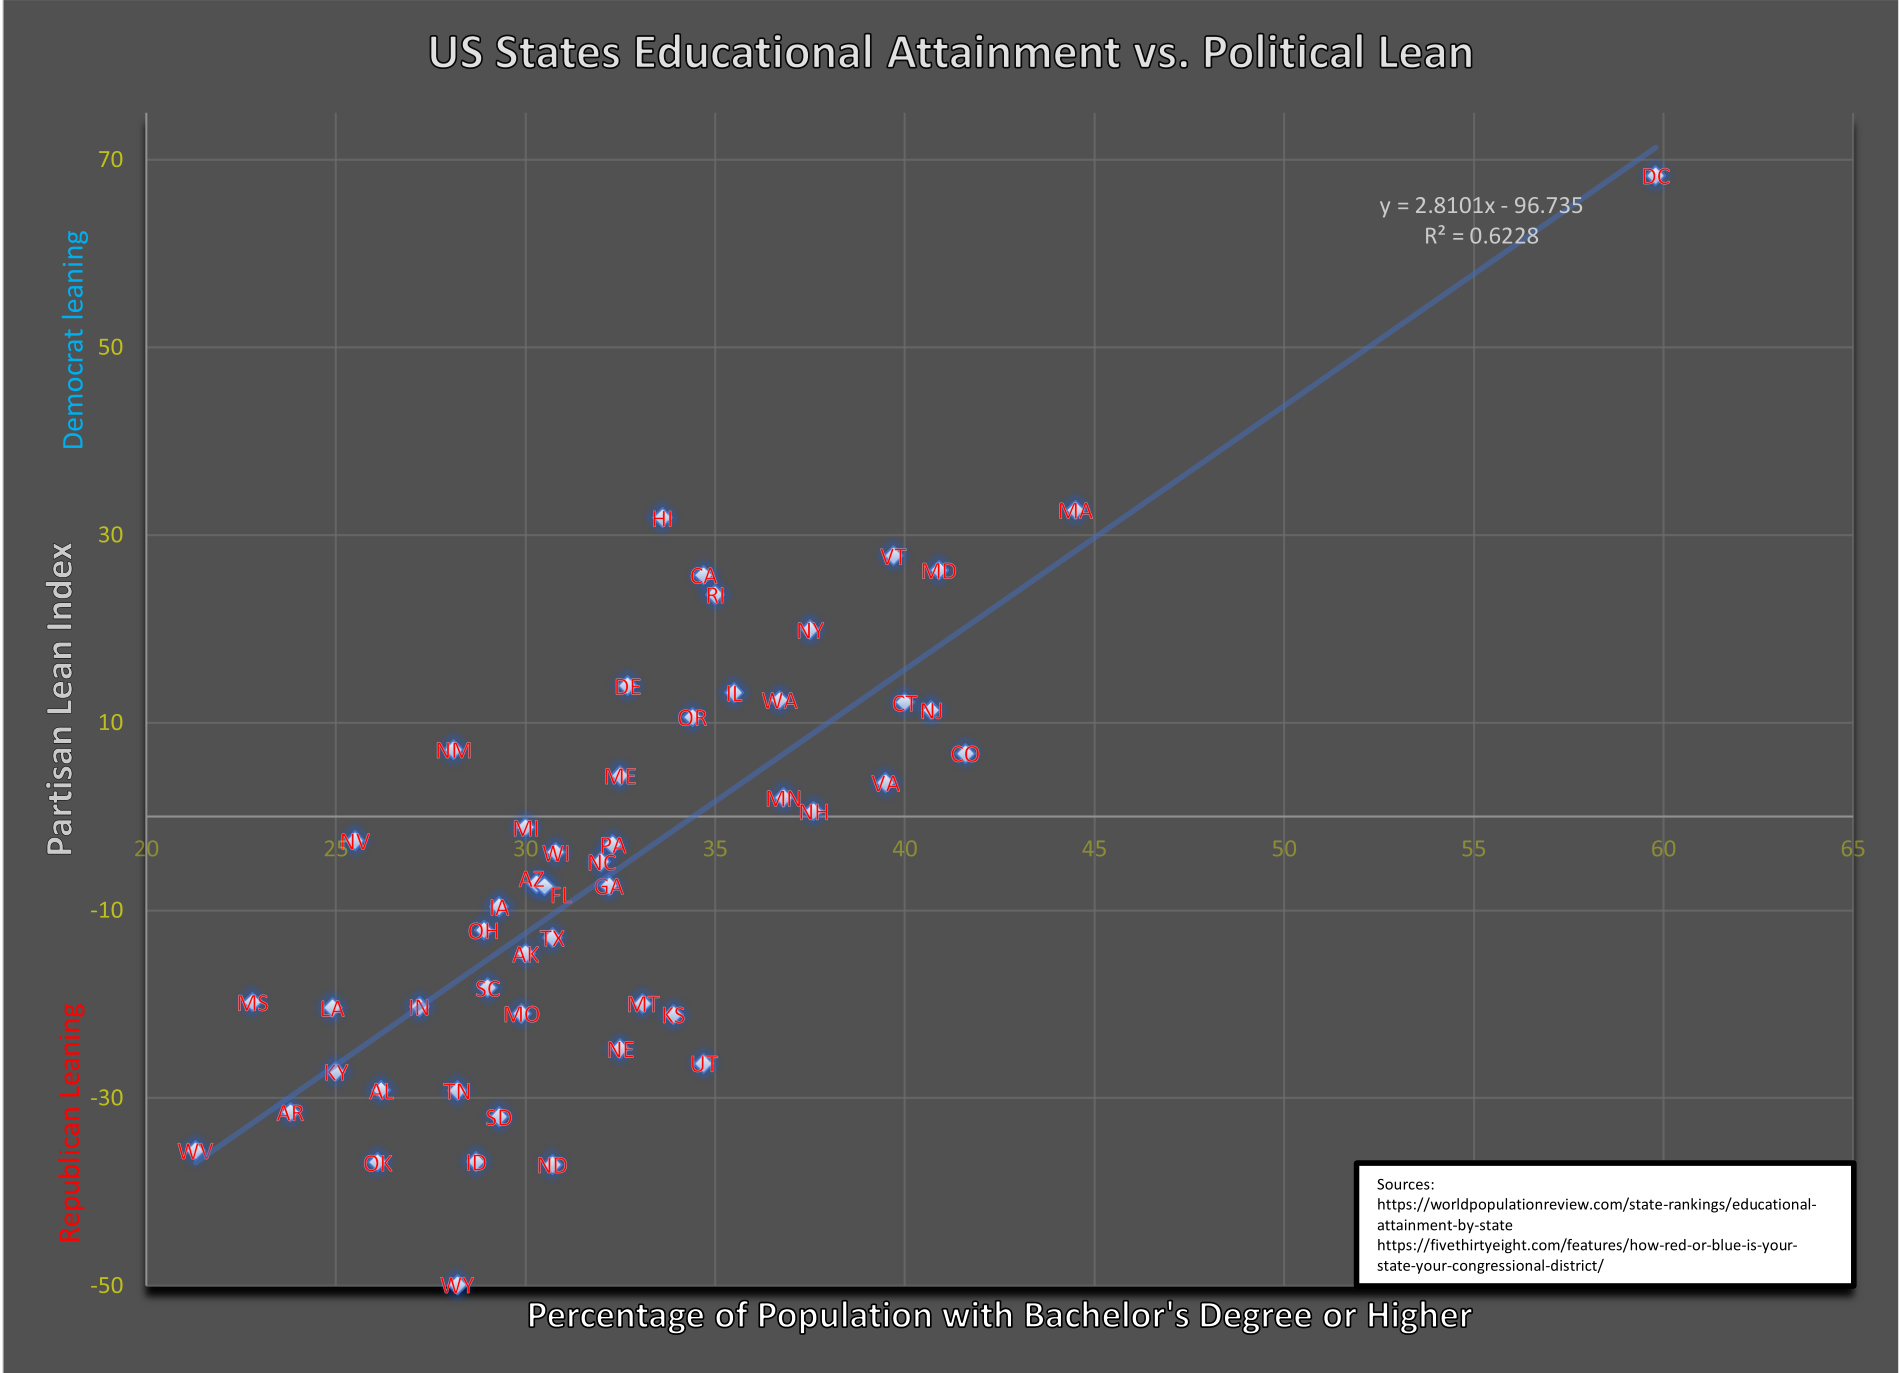
Data point for DC likely has very high leverage. How would the linear parameters and R squared values look if you exclude DC? What would that imply?
What a confused way to say: "the more you know the more you are a democrat".
The new parameters would be:
y = 2.8717x - 98.644
R² = 0.5251
So not very different, but DC improves the R^2 value somewhat.
For what it's worth, North Dakota and Wyoming have some of the highest average incomes, but are the reddest with the least education.
It's probably got more to do with rural vs. urban area. There's a lot of rich farmers in the midwest with not much education.
Was that regression line fit weighted by population?
Plus, oil is a huge industry in ND. You don't need a degree to work on a field.
No. Regardless of the state populations, if the line is a perfect fit, then the whole US population would be directly on the line. The entire US would have a partisan lean of 0 (by definition) and according to the source has a bachelors degree attainment of 32.9%, which is very close to the line but slightly above it.
Oil isn't a huge source of employment anymore in ND. The boom ended a while ago. I actually worked there back in 2013-14.
As someone who has a bachelors degree, it’s not that impressive
Interesting data but damn near impossible to read some of those state initials...
As it turns out, Excel makes it nearly impossible to increase the label sizes. I tried to make the picture resolution good enough that you can zoom in.
I am not a fan of these posts personally. And I say that as a left leaning person with a Masters Degree. I find them to be:
- Potentially divisive
- Ammunition for those wanting to dismiss alternative viewpoints without engaging with them
- A correlative relationship that too many people jump on as a causational relationship
This is a multi-variable relationship where many variables are here ignored, such as level of urbanisation, educational qualification requirements for large state employers, access to higher education, etc.
Too many left leaning folk will look at this and think "see, people who failed in school vote Republican" and there is simply not the available data here to draw that conclusion
The surge of these graphs has been strange. As someone who is currently pursuing an engineering PhD, I can confidently say that a degree has nothing to do with intelligence. There is no correlation between higher education implying intelligence and the party you vote for.
Id argue that it most definitely depends on what you’re majoring in , and if the industry you work for requires higher education. I think it’s safe to say that most business/finance/economics departments consist of right-leaning males, as do agricultural departments. Most liberal arts, software engineering, and environment departments would consist of left leaning males and females.
These posts hide way too much of what really goes on.
Just to add, my engineering department consists of a very even split between left and right, although most of us just really don’t give a damn in general.
To be completely honest, I agree. I made this post entirely to dunk on the one from yesterday that got 19k upvotes despite displaying the same data in a both ugly and one dimensional way. I don’t actually care about what correlation exists and what we can learn from it (very little).
I made this graph entirely to dunk on the one from yesterday that was both one dimensional and ugly. They even displayed it as a bar graph! I also stole the same data sources.
My experiment failed though, not many people seemed to like this post.
An honest karma whore. Refreshing!
It was just an experiment to see if for dumb correlations, this sub actually cared whether the data was readable and aesthetically pleasing.
The experiment failed.
It's just the result of people desperate to shit on those they don't like.
It's as if people don't like angry, bitter identity politics...
Kraz_I OP t1_jbmdh81 wrote
Sources:
https://worldpopulationreview.com/state-rankings/educational-attainment-by-state
https://fivethirtyeight.com/features/how-red-or-blue-is-your-state-your-congressional-district/
Tool used: Microsoft Excel
Inspired by THIS post, but I think this is a much more useful visualization of the data.