 [OC] police killings VS suicide rate – 2020 election
Submitted by terrykrohe t3_11zsqqi in dataisbeautiful
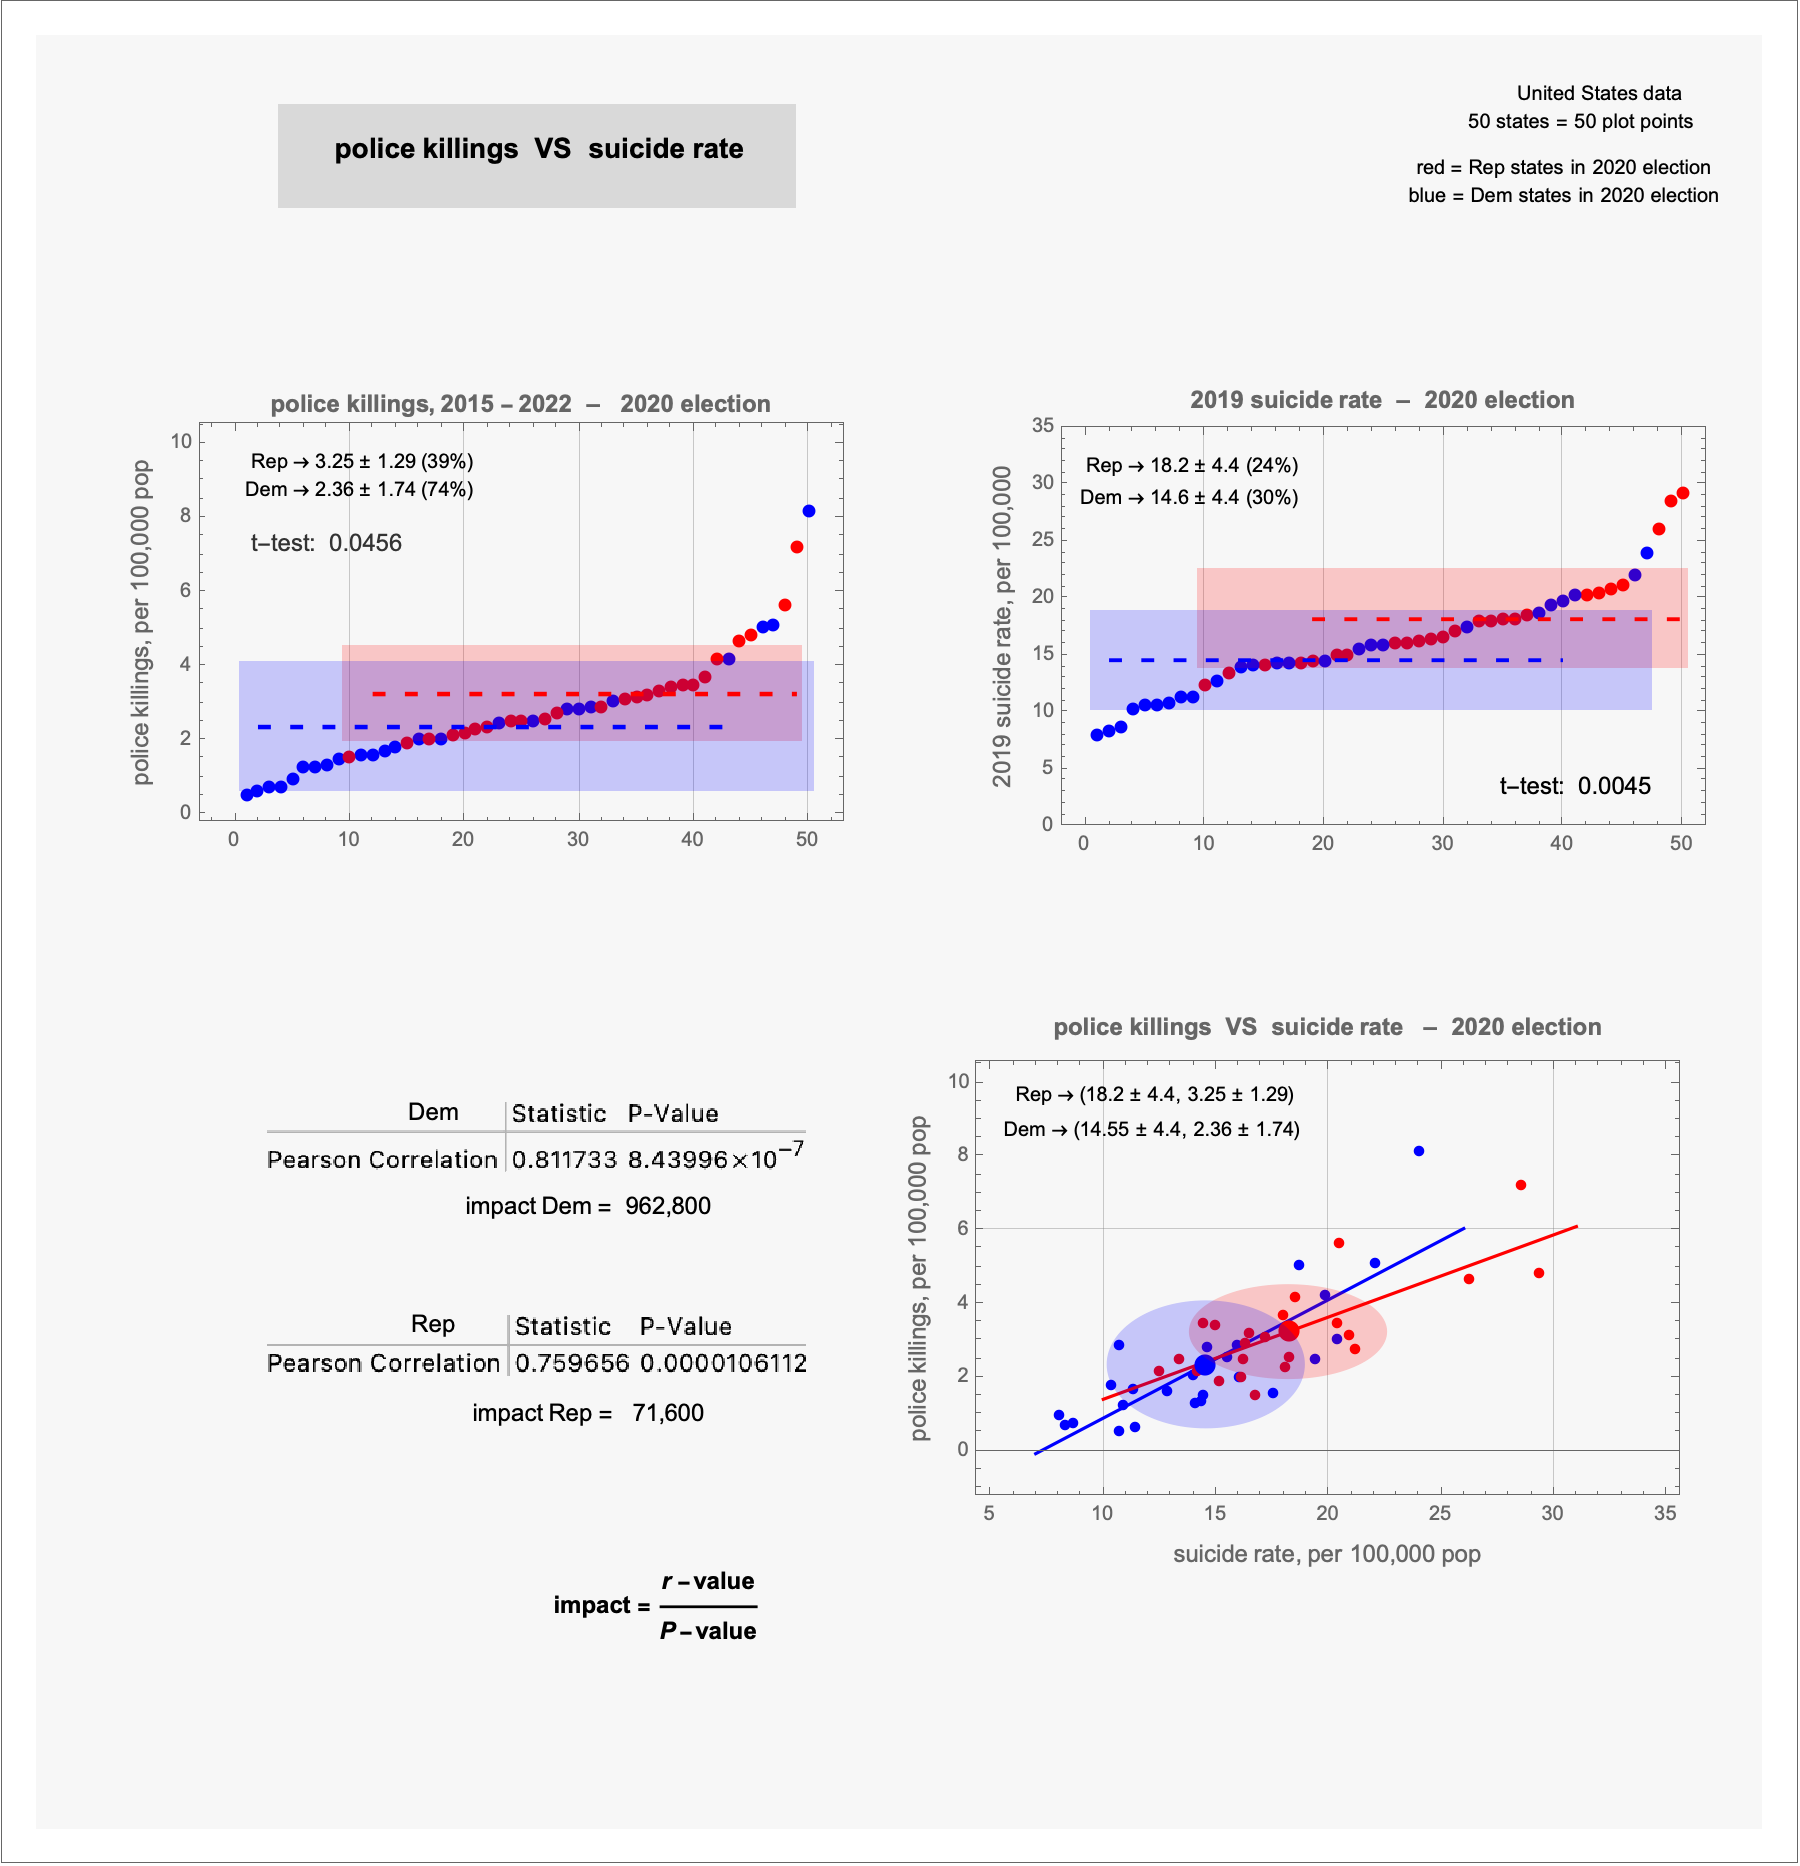
terrykrohe OP t1_jddxmf3 wrote
sources
police killings, US
– https://www.washingtonpost.com/graphics/investigations/police-shootings-database/
suicide rate
– https://www.cdc.gov/nchs/pressroom/sosmap/suicide-mortality/suicide.htm
tool: Mathematica
***************
– the dashed lines are the means; the 'boxes' are ± one standard deviation (SD) from the mean
– the parenthetical percent is the "relative standard deviation" (RSD)
– for the bottom plot
...red/blue lines represent the 'best-fit' through the Rep/Dem states' data points; the states' coordinate points are colored according to the 2020 Electoral College vote
– the ellipses are centered on the Rep/Dem means; the standard deviations are represented by the ellipses' axes
"Statistic" is the "Pearson r-value
"the r-value is a measure of the "strength" of the correlation;
the p-value is the probability that the r-value represents random fluctuations of the data (that is, a small p-value would characterize non-random data)
Viewing a single comment thread. View all comments