 [OC] police killings VS suicide rate – 2020 election
Submitted by terrykrohe t3_11zsqqi in dataisbeautiful
terrykrohe OP t1_jddyrpe wrote
other comments for "police killings VS suicide"
1
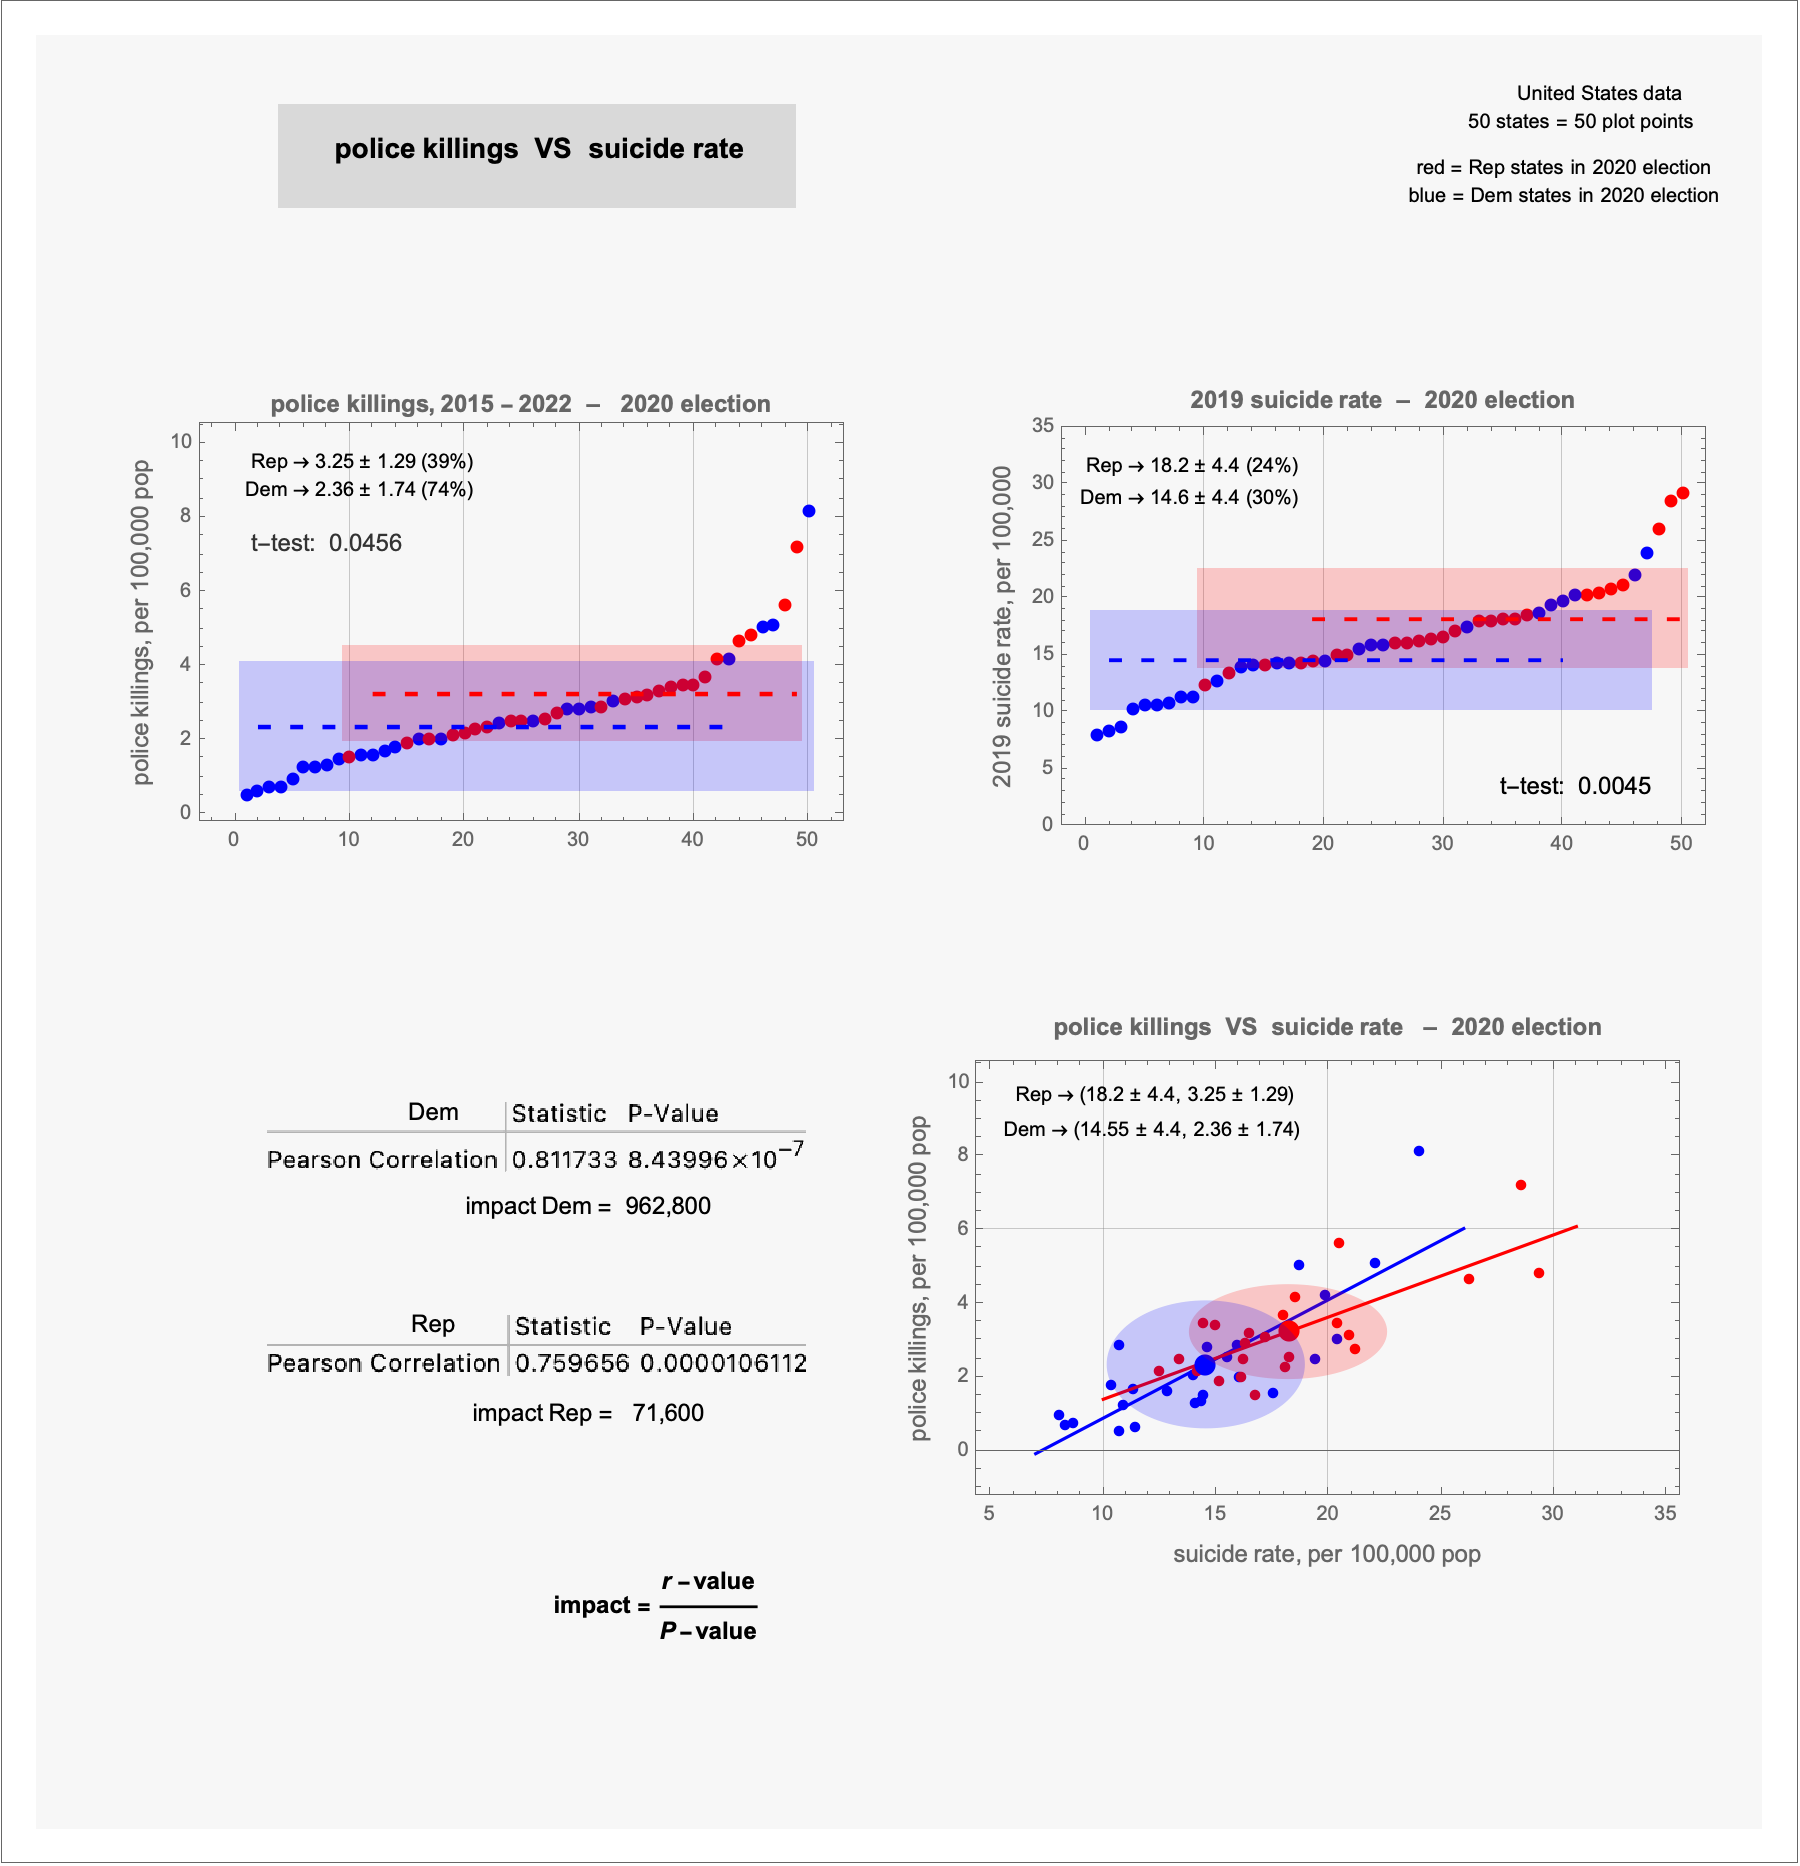
... there is a non-random, top/bottom, RepDem pattern in the "police killings" data and in the suicide data.
This pattern has been seen in previous posts: GDP (posted 06May2021), state+local ed spending (posted 20May2021), suicide rate (13May2021), state taxes (posted 17Jun2021), opioid dispensing rate (01Jul2021), life expectancy (29Jul2021), infant mortality (05Aug2021), incarceration rate (posted 19Aug2021)
,... only 'missing persons' (posted 28Oct221) showed randomness
... drug overdose deaths (posted 23Feb2023) was 50/50 random/non-random probability
... always, the Rep states were on the negative side of the metric: less GDP, less ed spending, more suicides, lower state taxes, more opioids dispensed, shorter life expectancy, more infant mortality, higher incarceration rates.
2
Suicides correlate strongly with gun ownership (posted 02Mar2023)
– Rep correlation, impact value = 42,100; Dem correlation, impact value = 27,500
now, suicides correlate more strongly with police killings than with gun ownership
– Rep correlation, impact value = 71,600; Dem correlation, impact value = 962,800
(... curious that Dem states have a much stronger police killings/suicide correlation than Rep states)
3
There is a "rationale" that 'explains' the suicide/gun ownership correlation: gun availability.
What rationale would explain the police killings VS suicide data?
(" a coincidence"? nah, "... there are no coincidences," says Detective)
Viewing a single comment thread. View all comments