Submitted by terrykrohe t3_11zsqqi in dataisbeautiful
Submitted by terrykrohe t3_11zsqqi in dataisbeautiful
sources
police killings, US
– https://www.washingtonpost.com/graphics/investigations/police-shootings-database/
suicide rate
– https://www.cdc.gov/nchs/pressroom/sosmap/suicide-mortality/suicide.htm
tool: Mathematica
***************
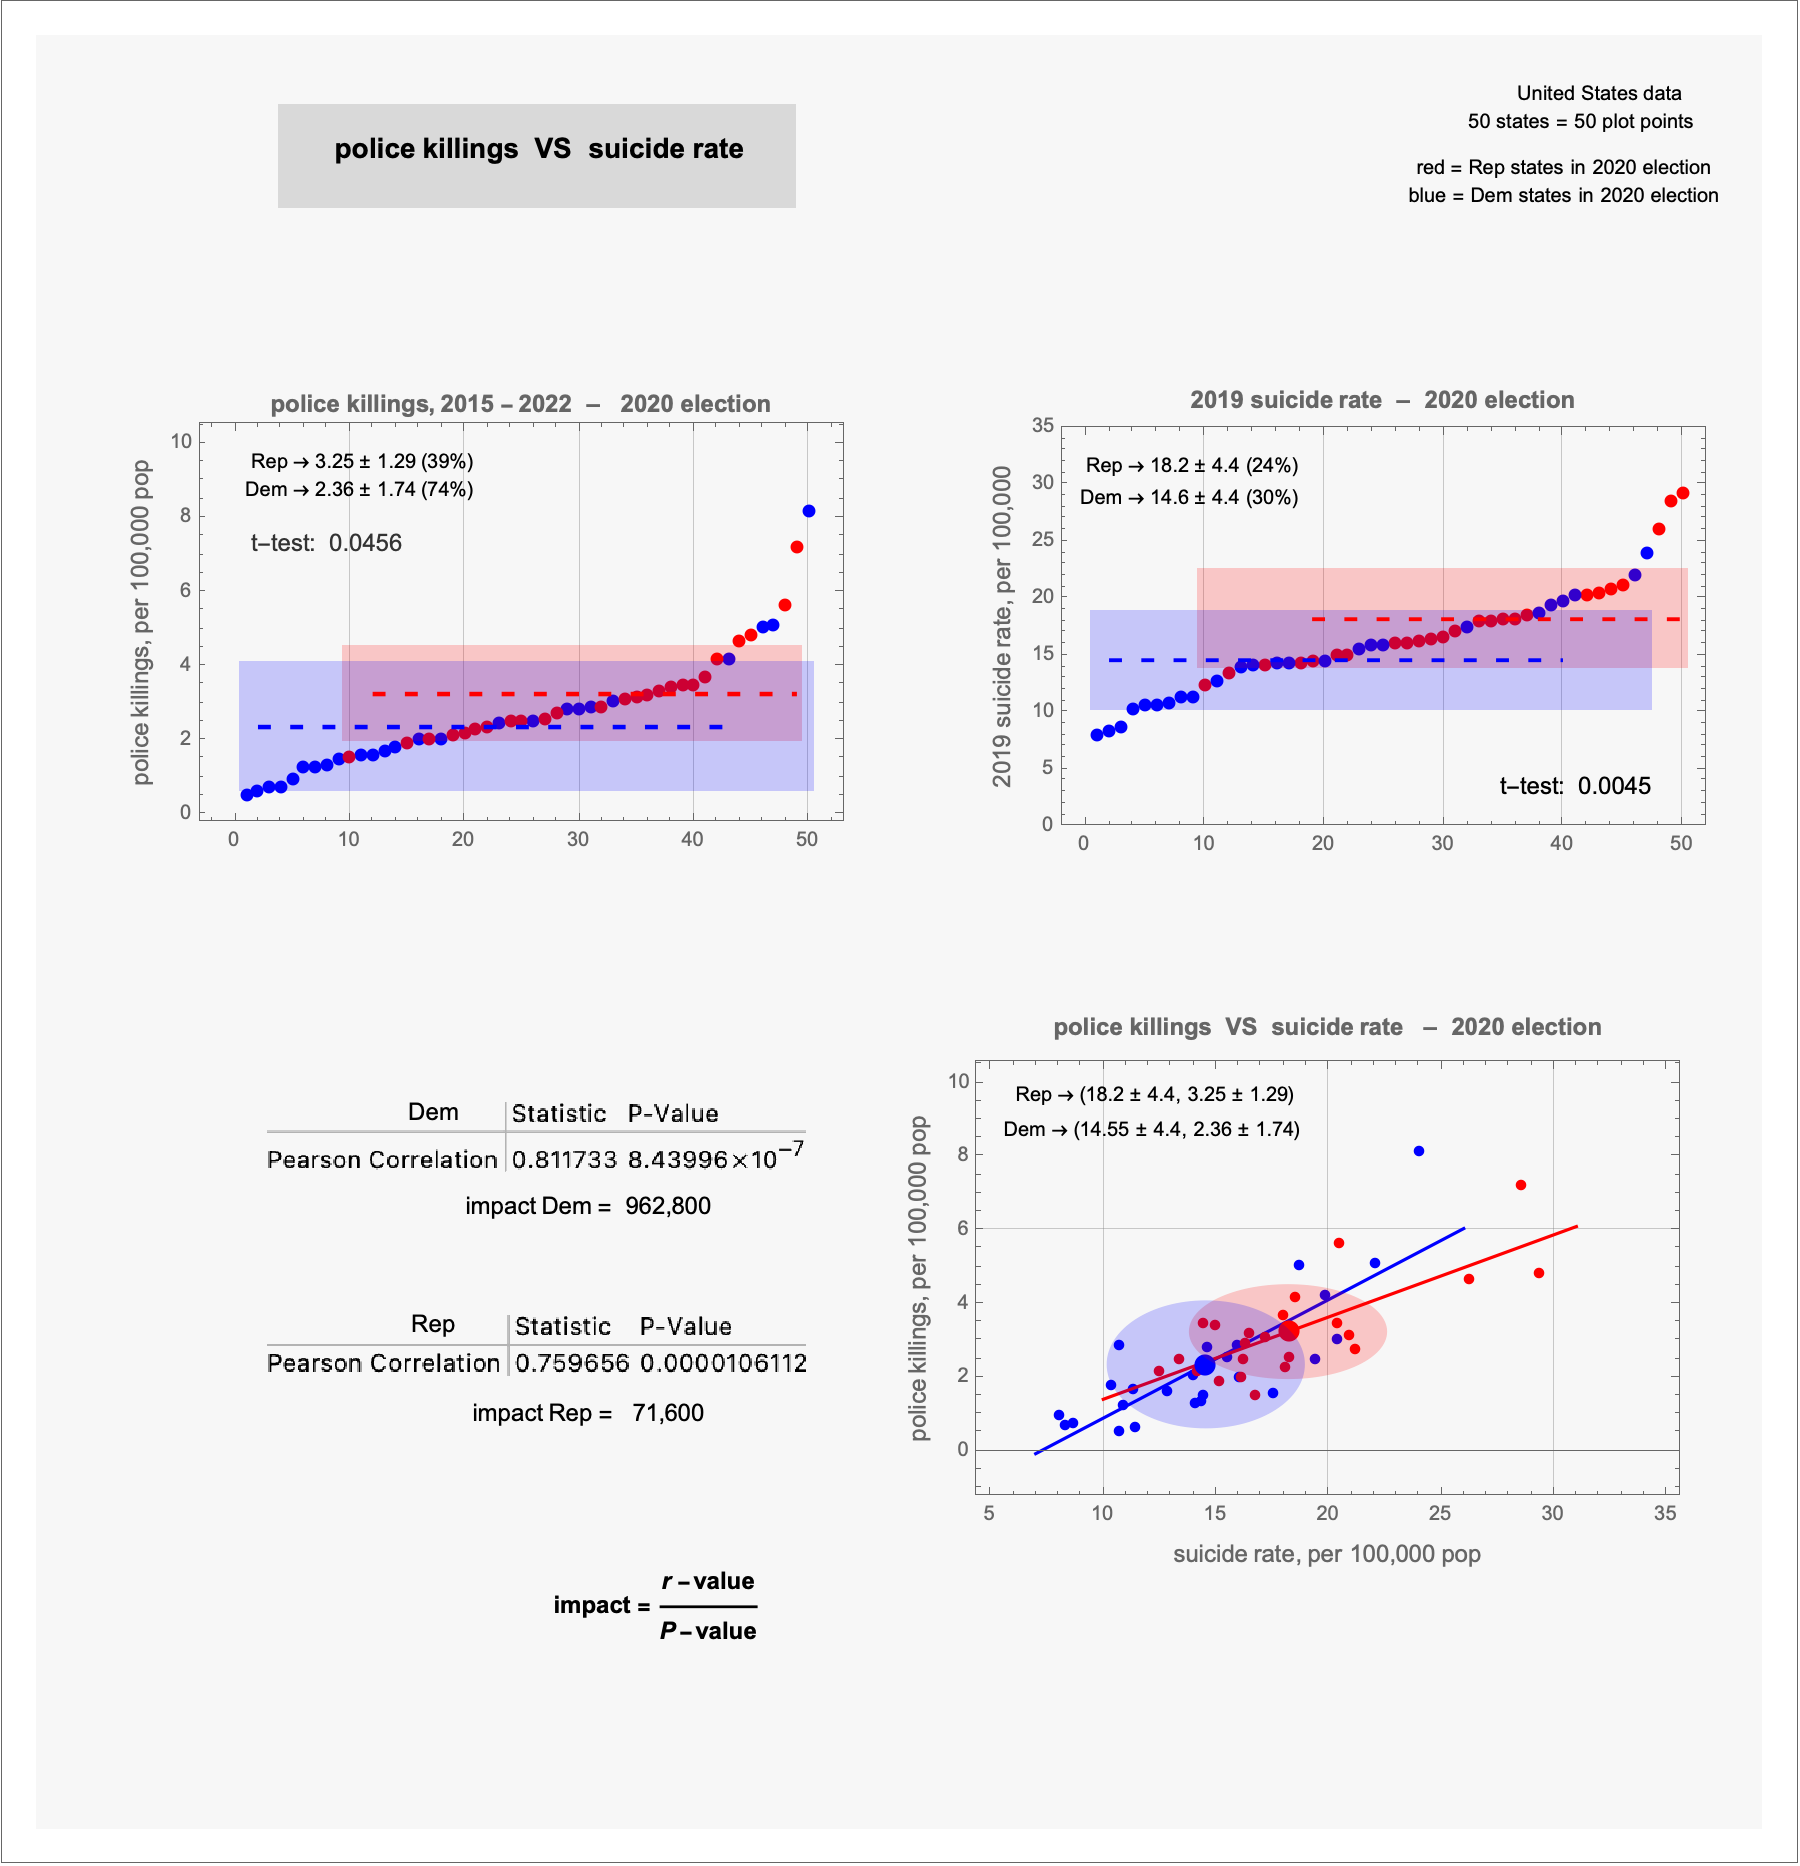
– the dashed lines are the means; the 'boxes' are ± one standard deviation (SD) from the mean
– the parenthetical percent is the "relative standard deviation" (RSD)
– for the bottom plot
...red/blue lines represent the 'best-fit' through the Rep/Dem states' data points; the states' coordinate points are colored according to the 2020 Electoral College vote
– the ellipses are centered on the Rep/Dem means; the standard deviations are represented by the ellipses' axes
"Statistic" is the "Pearson r-value
"the r-value is a measure of the "strength" of the correlation;
the p-value is the probability that the r-value represents random fluctuations of the data (that is, a small p-value would characterize non-random data)
other comments for "police killings VS suicide"
1
... there is a non-random, top/bottom, RepDem pattern in the "police killings" data and in the suicide data.
This pattern has been seen in previous posts: GDP (posted 06May2021), state+local ed spending (posted 20May2021), suicide rate (13May2021), state taxes (posted 17Jun2021), opioid dispensing rate (01Jul2021), life expectancy (29Jul2021), infant mortality (05Aug2021), incarceration rate (posted 19Aug2021)
,... only 'missing persons' (posted 28Oct221) showed randomness
... drug overdose deaths (posted 23Feb2023) was 50/50 random/non-random probability
... always, the Rep states were on the negative side of the metric: less GDP, less ed spending, more suicides, lower state taxes, more opioids dispensed, shorter life expectancy, more infant mortality, higher incarceration rates.
2
Suicides correlate strongly with gun ownership (posted 02Mar2023)
– Rep correlation, impact value = 42,100; Dem correlation, impact value = 27,500
now, suicides correlate more strongly with police killings than with gun ownership
– Rep correlation, impact value = 71,600; Dem correlation, impact value = 962,800
(... curious that Dem states have a much stronger police killings/suicide correlation than Rep states)
3
There is a "rationale" that 'explains' the suicide/gun ownership correlation: gun availability.
What rationale would explain the police killings VS suicide data?
(" a coincidence"? nah, "... there are no coincidences," says Detective)
I can't math too good, but I can at least count to two, which is at least how many people don't understand this graph...
1
top, left: shows the fifty states separated by their 2020 election vote (red/Rep and blue/Dem); the source data is worked up to determine the police killings per 100,000 pop and tabulated; the ranked table is visually presented ... identifying the states is not important: the importance is in the non-random, top/bottom pattern of the data
2
the top, right: is a visualization of source suicide per 100,000 pop data
3
– the means and standard deviations of the Rep and Dem data are represented by the dashed lines and the shaded boxes
– the t-test compares means of Sample populations: low t-test values indicate that the means are NOT due to random data fluctuations
4
the bottom plot
– plots the (suicide, police killings) coordinates for each state
– a best fit line is determined for the Rep and Dem coordinates
– the Pearson correlation calculates how 'strong' the data fits the best-fit line (0.81 and 0.75 are strong correlations)
– the "P-value" is the probability that the Pearson "r-value" represents random fluctuation of the data
– smaller P-values indicate less random character of Sample data
5
the "impact value" use the r-value and the P-value to quantify the data fit
– just looking at the plot coordinates, the best fit lines, and the Pearson values ... it is (for me) hard to see that the Dem correlation is so much stronger than the Rep correlation; but the impact value informs me so.
Consider adding all Murders with this.
Purpose
Police killings and suicides, it seems, are different spheres of activity and would/should have NO connection/correlation (excepting suicide-by-cop).Butthe data says there IS correlation.
That is, why would a state with a high suicide rate also have a high police killing rate?
conversely, why would a state with a low suicide rate also have a low police killing rate?
How? Why?
This data... is not beautiful. Nor easily understood.
Keats, "Ode on a Grecian Urn" –
Thou shalt remain, ... a friend to man, to whom thou say'st,
"Beauty is truth, truth beauty,
– that is all Ye know on earth, and all ye need to know."
... as for "Nor easily understood"
I agree, I do not understand how police killings and suicides are correlated:
The most beautiful thing we can experience is the mysterious. It is the source of all true art and science. He to whom the emotion is a stranger, who can no longer pause to wonder and stand wrapped in awe, is as good as dead; his eyes are closed.
Have you tried mapping all the other causes of death?
Also, you're comparing two disparate stretches of time leading up to the same endpoint. That seems like bad practice.
I'm also not seeing where the wapo link you provided gives data on the party affiliation of the people who were shot. Is that data just a reflection of the location, then?
I'm not a data scientist, but this feels very pegboards-and-strings-across-the-room kind of scenario.
Everyone say it with me.
“Correlation does NOT imply causation.”
Why is there a correlation? No idea. No evidence they are connected in any way unless a focused experiment is conducted.
The top graphs really need an x axis. My best guess is that it's each state's index, or something like that? Not sure how that's useful, but that's what it looks like.
Apples to oranges. The WaPo dataset is behind a paywall so I cannot verify, but you used the term ‘police killings,’ whereas WaPo uses the term ‘police shootings.’ From previous interaction with the dataset I believe the WaPo source excludes non-firearm ‘police killings.’
You said yourself, suicide correlates with firearm ownership; I propose ‘police shootings’ likely correlates with the presence of firearms in police encounters which likely correlates to availability of firearms.
Furthermore, as somebody else mentioned, the time domain differs between the sets. You have different time periods, different classification criteria, potentially overlapping datapoints treated as distinct events. I do not believe any valid conclusions or observations could really be made from this presentation.
Someone got triggered by a graph — yikes.
[deleted]
This data means nothing without levels of significance and p-values alone are not really helping. Not sure why they wouldn't run a linear regression model. Or maybe it is but it is just confusing to parse through.
... the WaPost data indicates the state of each death; the total of deaths for each state was calculated. If that state was Indiana, it is a red plot point; if Vermont, it is a blue plot point, etc
SlowCrates t1_jddxgbk wrote
I don't understand this graph