 [OC] best-fit lines, correlations: incarceration vs evangelical – 2020 election
Submitted by terrykrohe t3_yfcfk0 in dataisbeautiful
terrykrohe OP t1_iu2ujob wrote
- Purpose
In order to 'understand' the non-random, top/bottom, Rep/Dem differentiation of metric values, eight "response" metrics are correlated with three "predictor" metrics. This post presents the 'response' variable incarceration vs the evangelical 'predictor' metric.
... the eight "response" metrics: GDP, state taxes; suicide rate, opioids; life expectancy, infant mortality; incarceration, state+local ed spending;
... the three "predictor" metrics: 'rural-urban', evangelical, diversity* - the "big picture"
i) There is a non-random, top/bottom, Dem/Rep pattern. Patterns have reasons/causes and are mathematical.
ii) Rep states are always on the negative side (less GDP, more suicides, lower life expectancy, etc).
iii) How did 150 million voters, acting individually, separate the fifty states into two such disparate groups?
iv) is there a "predictive" metric or combination of metrics which can be used to explain the characteristic Rep/Dem differences seen in the data? - general comments
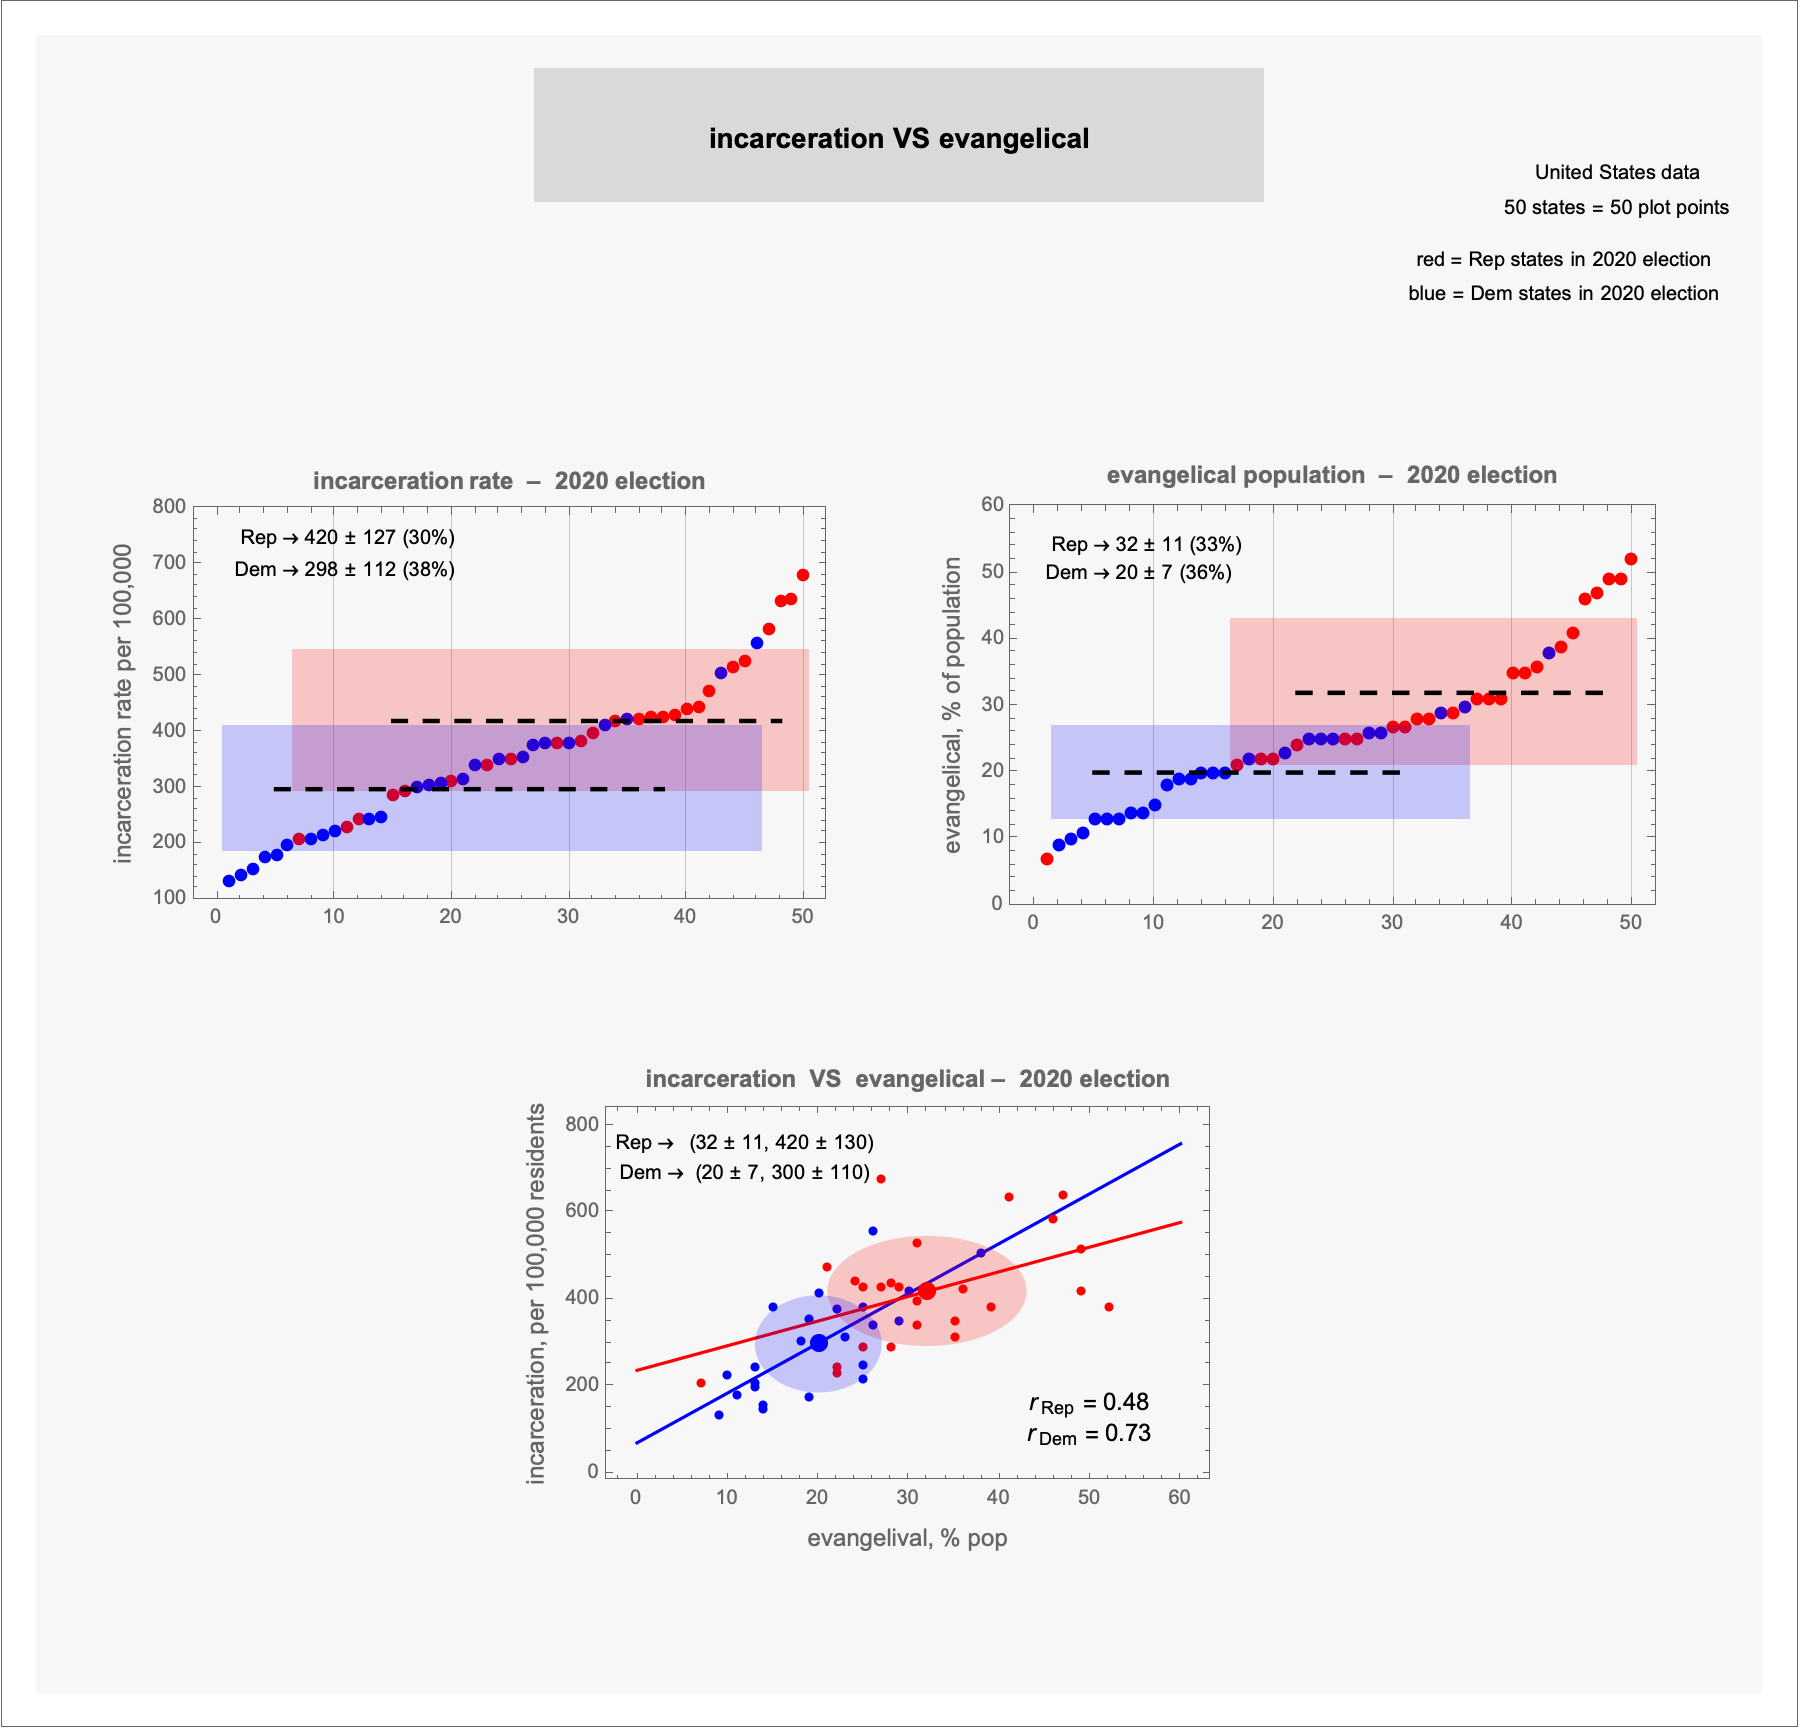
i) for Rep and Dem states: incarceration rate increases as evangelical increases; slopes are large and r-values are large
ii) the Dem r-value is larger than Rep r-value
iii) the large Rep and Dem slopes indicate that evangelical impact on incarceration is significant
iv) evangelical impact on all response metrics appears to be the most influential of the three predictor metrics:
GDP vs evangelical, posted 06Jan
state taxes vs evangelical, posted 03Feb
suicide rate vs evangelical, posted 03Mar
opioid dispensing rate vs evangelical, posted 12may
life expectancy vs evangelical, posted 06Aug
infant mortality vs evangelical, posted 01Sep
Viewing a single comment thread. View all comments