Submitted by terrykrohe t3_yfcfk0 in dataisbeautiful
Submitted by terrykrohe t3_yfcfk0 in dataisbeautiful
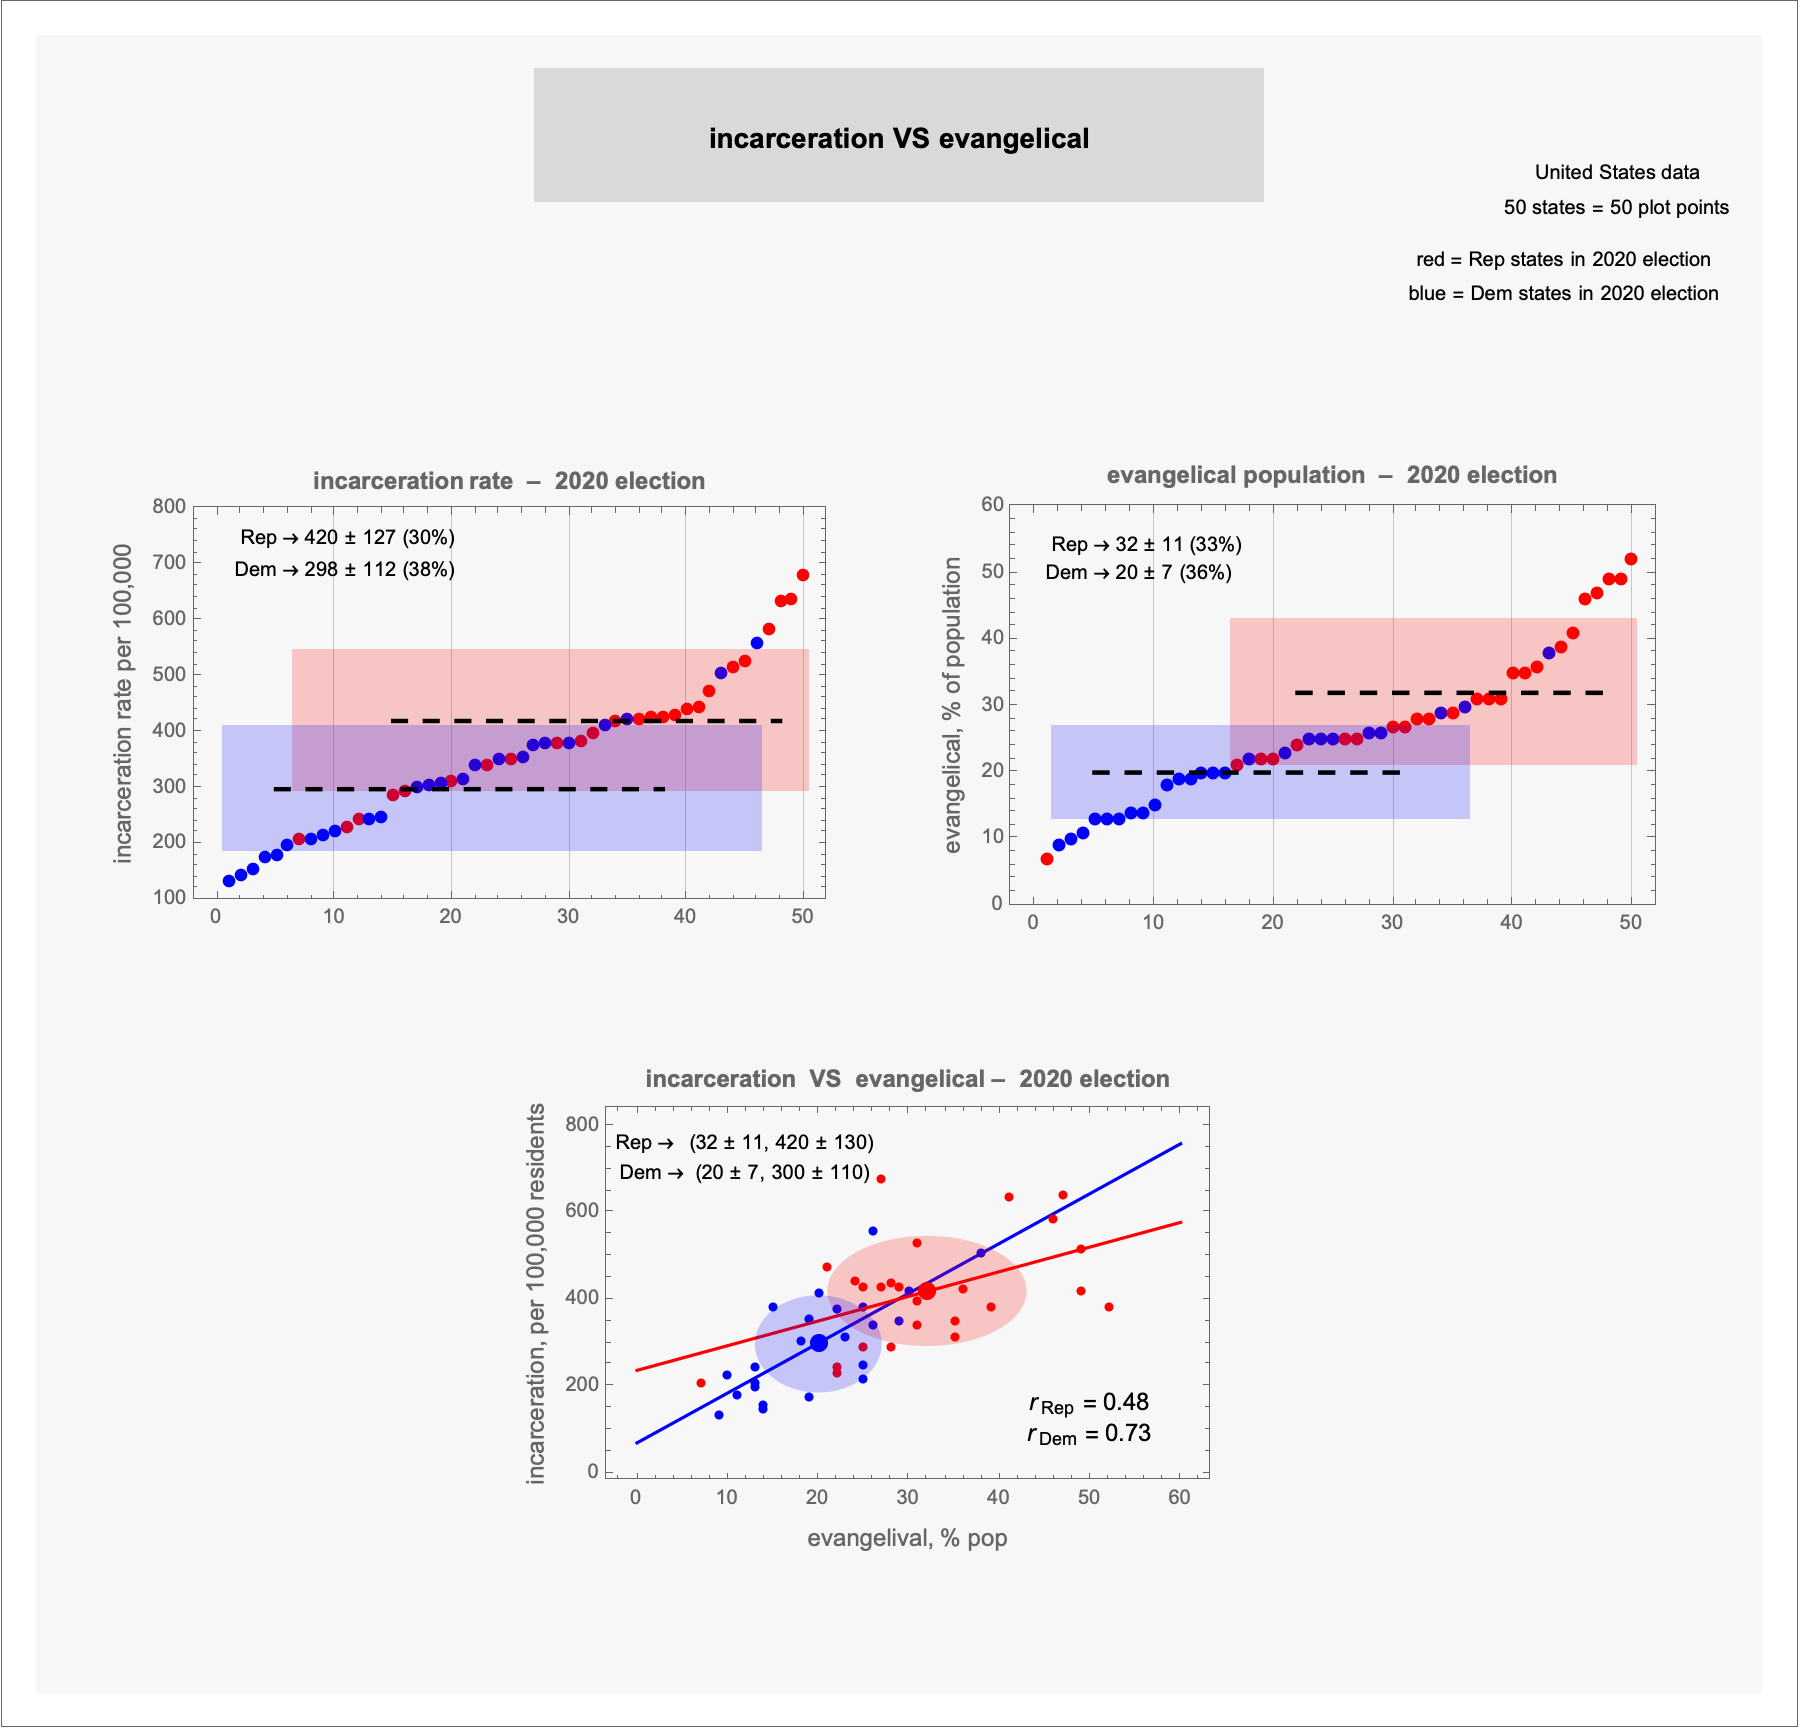
Chart 1 seems to indicate a higher incarceration rate to Republican states. Chart 2 seems to imply a correlation of evangelical tendencies to Republicans. Chart 3 seems to show that it does party affiliation doesn't really matter in the face of evangelism and locking people up.
Conclusion, righteous is as righteous does. Not terribly surprised at this outcome. Seen plenty of self declared "liberals" who have just a mean streak of "do the crime, do the time" attitude with zero regard for circumstances.
This account is just a propaganda bot. Look at its lost history, this is literally all it does!
1
... the posts do have a uniform style; but the content of each post is unique
2
... the purpose of the post is explained in a previous comment: to repeat: there is a non-random top/bottom Rep/Dem differentiation of the data; in which, the Rep states are always on the negative side. This generality is worth noting and, even more worthy, is an investigation using other metrics to (maybe) unearth an explanation.
Montaigne, "Of Pedantry": has a quoted comment– 'I hate above all pedantic learning'; to which he adds – We labor only to fill our memory, and leave the understanding and conscience empty.
3
... this Rep/Dem differentiation has been noted elsewhere:
– https://www.thirdway.org/report/the-red-state-murder-problem
(see post 08Jul2021)
– https://www.theguardian.com/us-news/2022/oct/27/life-expectancy-us-conservative-liberal-states
(see post 29Jul2021)
The explanation is obvious: people who observe their tax money being constantly wasted on lazy people and criminals are more likely to become Conservative. It's a lot easier to have egalitarian views when you're not constantly faced with the system getting abused.
The explanation is obvious: conservative jurors are religious and stubbornly believe in inherent sin. They are therefore more likely to vote "guilty", independet of the actual guilt, evidence, case or whatever.
There. It's basically the opposite of your opinion and it is just as worthless and empty.
Actually, what this shows is that holier than thou people love locking people up regardless of their party affiliation. Because punishment IS their religion.
Wish we sad some more of those people around here so I could actually use the subway without having to step over homeless people and fear for my life.
This is something you can't get out of the data, that is something you believe.
The data just shows the correlation. It doesnt show whether states in that segment will just vote republican or if republican states will move into that segment (as a result of the policies). That interpretation is something everyone has to do for themselfs.
Oh, absolutely it's from my lived experience seeing why people vote the way they do. Obviously the data only shows the correlation, not the causation.
Doesn't what you say imply that the poor in blue states are more well-behaved and less exploitative than the poor in red states?
What would you guess to be a reason for that?
The reason is very obvious, but we're not supposed to talk about it on Reddit.
/u/terrykrohe would it be possible to do one plotting percentage of impoverished population that's black people against incarceration categorized by R and D?
Our boy here has a hypothesis for a cause of incarceration and surely the correlations for the "obvious explanation" will be stronger than the correlations for the alleged Effect of political affiliation.
I found data from the StLouis Fed Reserve and from the sentencing project source ... I will work something up
It would be a plot of black/white income ratio VS black/white incarceration ratio using the Rep/Dem state differentiation.
... thanks for the suggestion – it should be interesting
terrykrohe OP t1_iu2u6is wrote
sources
– incarceration
https://www.sentencingproject.org/the-facts/#map
– evangelical population
https://www.pewforum.org/religious-landscape-study/religious-tradition/evangelical-protestant/
tool: Mathematica
***************
– the ellipses are centered on the Rep/Dem means;
the standard deviations are represented by the ellipses' axes
– the 50 plot points represent the (evangelical, infant mortality) coordinates for each state;
and are colored according to their 2020 Electoral College vote
– "r" is the Pearson correlation value