Submitted by alx_www t3_y4tdbu in dataisbeautiful
Comments
abebrahamgo t1_isi0cwz wrote
I think it would take me less time to learn python and make my own chart than understand this.
[deleted] t1_isi3g45 wrote
[removed]
WordsButFunny t1_isiqqsv wrote
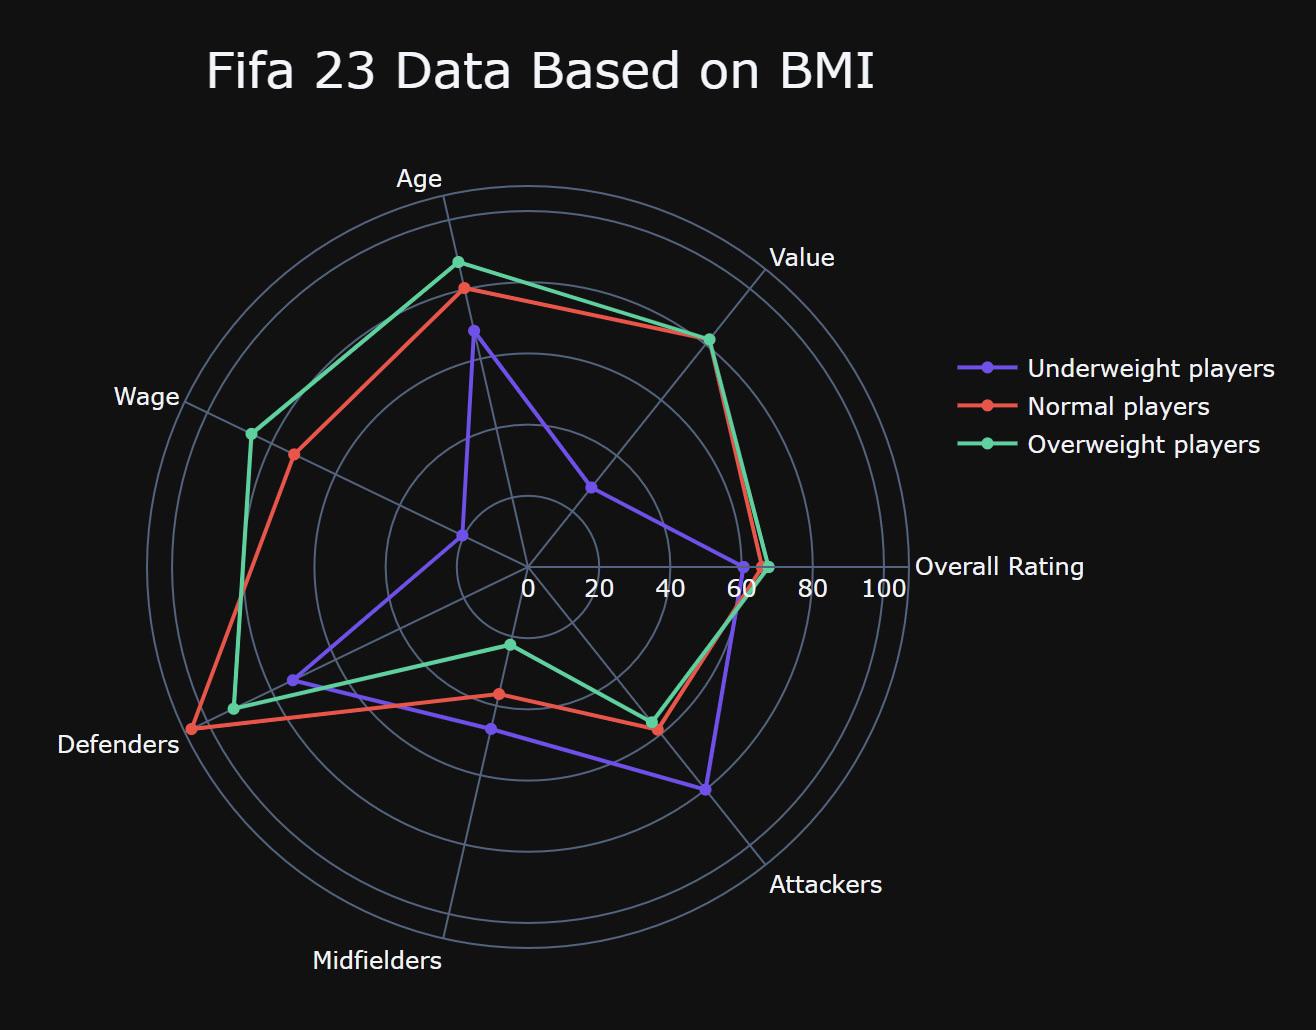
I think I get it. On the whole, defenders are most likely to be normal weight, then overweight.
Midfielders and attackers are mostly underweight, then normal weight.
Overweight players have a slightly better rating overall.
Players who are overweight tend to be older.
summernightsmood t1_iskufac wrote
I actually found this interesting. Thanks for sharing.
alx_www OP t1_iskun1f wrote
thank you!
alx_www OP t1_isfsstu wrote
I got the data from (https://www.kaggle.com/datasets/cashncarry/fifa-23-complete-player-dataset). The tool used to generate the visual (Python (plotly))
[deleted] t1_isg3r06 wrote
[removed]
WordsButFunny t1_isiqvdz wrote
Could you run this again filtering for only players rated > 75?
geratwhiskers t1_isj2fm5 wrote
I'm sorry but this chart is bad and not understandable.

BobMcFail t1_isgu5h8 wrote
That makes zero sense from a presentation stand point.