Submitted by N3XT191 t3_ycnavk in dataisbeautiful
Comments
ShadowSlayer1441 t1_itngkm8 wrote
The craziest part of this to me is that in my current math class we’re going to cover everything you mentioned. We’re covering eigeinvalues on Wednesday and laplace transformations later. I’m so excited to get into these higher level math topics! Mechanical vibrations was so cool.
electronics95 t1_itnhckz wrote
Well, dynamical systems are everywhere, and if one studies engineering/physics/maths... They will be covered.
futurebigconcept t1_itp07h4 wrote
Look at the big brain on Brad.
N3XT191 OP t1_itn5gv5 wrote
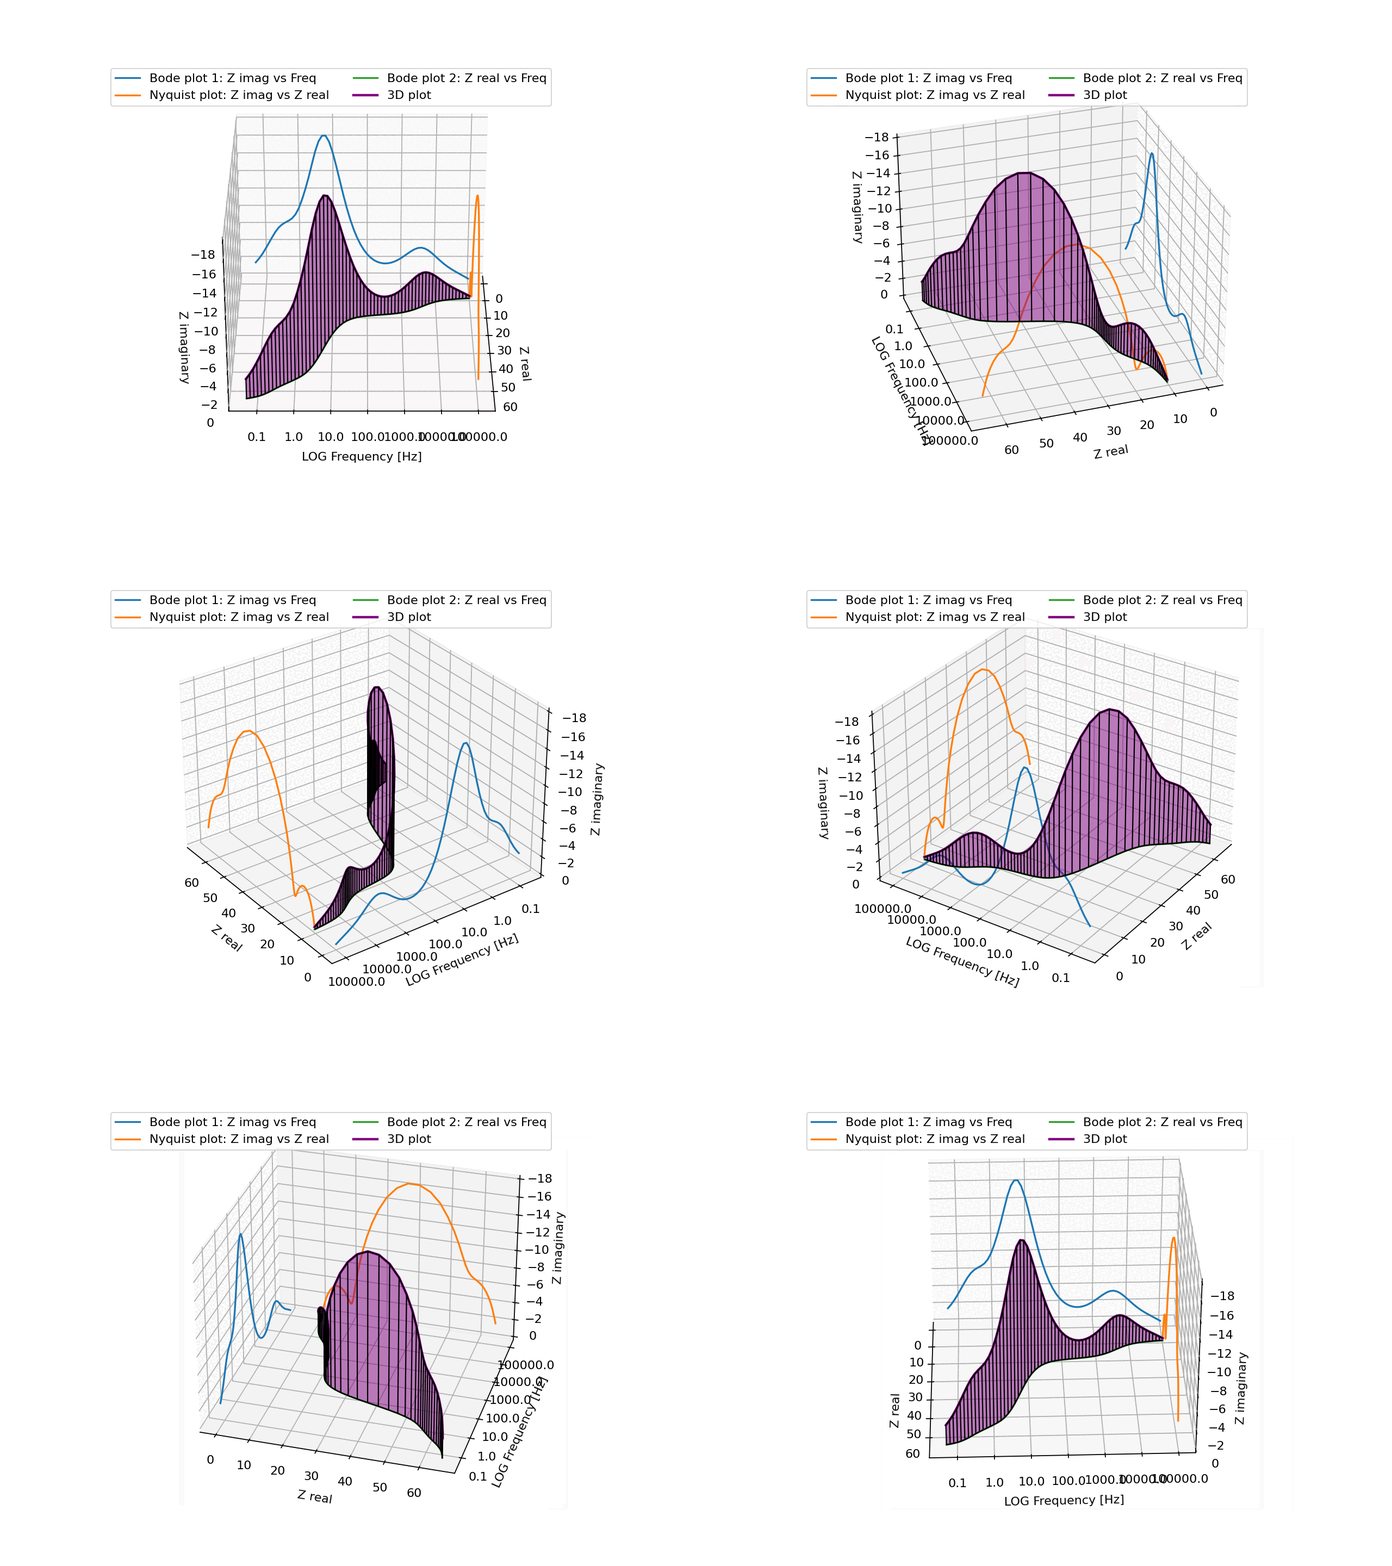
Data: Measured by a friend, slightly smoothed.
Tools: Matplotlib
sourcecode: https://pastebin.com/raw/WyEkseCA
Honestly, I have no idea what this actually means, it's something about electrical circuits in a solar panel, I just did the cool 3D visualisation...
Suggestions always welcome!
No-Establishment4871 t1_itnus03 wrote
Really cool animation. I would almost prefer it to be slowed down but it's great stuff!
TheSpanishKman t1_itu36l4 wrote
As someone who loves Control Engineering this is just like art. Outstanding job :)
N3XT191 OP t1_itu5z6d wrote
I understand very little of what any of this data means, but I am quite proud of how readable the graph is. (with the exception of details like the freq axis ticks...)
In general, it is very hard to interpret a single line in 3D from just a static plot. Even with the 3 projections onto the 3 "walls", it's not easy to intuitively understand the shape of the line and how it behaves.
The regularly spaced vertical lines together with the semi-transparent fill make it surprisingly easy to just understand the shape, simply from looking at it. And basically from any direction.
There aren't too many real-life cases where you have a single line in a 3D space, but I'm definitely going to use this exact visualisation again if I ever come across one!
[deleted] t1_itnlhug wrote
[removed]
haboob7 t1_itnywj8 wrote
Can you explain this for us dumb people
Glass_Sir_5010 t1_ito0eb1 wrote
Excited about these beautiful curves in 3d. What does it all mean?
[deleted] t1_itoawk2 wrote
[removed]
[deleted] t1_itow3t2 wrote
[removed]

electronics95 t1_itnc4lr wrote
Both Bode and Nyquist plots are used to determine whether a system is stable, and in that case, how robust it can be, at various frequencies of the input variable.
There is a LOT of math (differential equations, matrices, eigenvalues, complex numbers, Laplace transforms...) behind these, it's quite interesting.