Submitted by lambofgod0492 t3_ynarvj in dataisbeautiful
Comments
Reddituser183 t1_ivaaj7v wrote
Yeah you should do another but go back to 91.
ChasingHorizon2022 t1_ivaklqn wrote
We don't talk about 91
Reddituser183 t1_ivant1c wrote
Unless you’re on the Minnesota sub and it’s a day ending in y.
Qastodon t1_iv84egc wrote
So there is less snow now?
thicknslicey t1_iv8e5nd wrote
Yes, there is currently no snow.
grantnel2002 t1_iv9nf3h wrote
Looked outside, can confirm, no snow.
khaaanquest t1_iv9z5u9 wrote
Quick update for yall, currently measuring 0.0 inches of snow
grantnel2002 t1_iv9zuo6 wrote
Please keep us up to date with hourly reports.
[deleted] t1_ivd6lkk wrote
[deleted]
[deleted] t1_ivakkqd wrote
[removed]
needknowstarRMpic t1_ivauz25 wrote
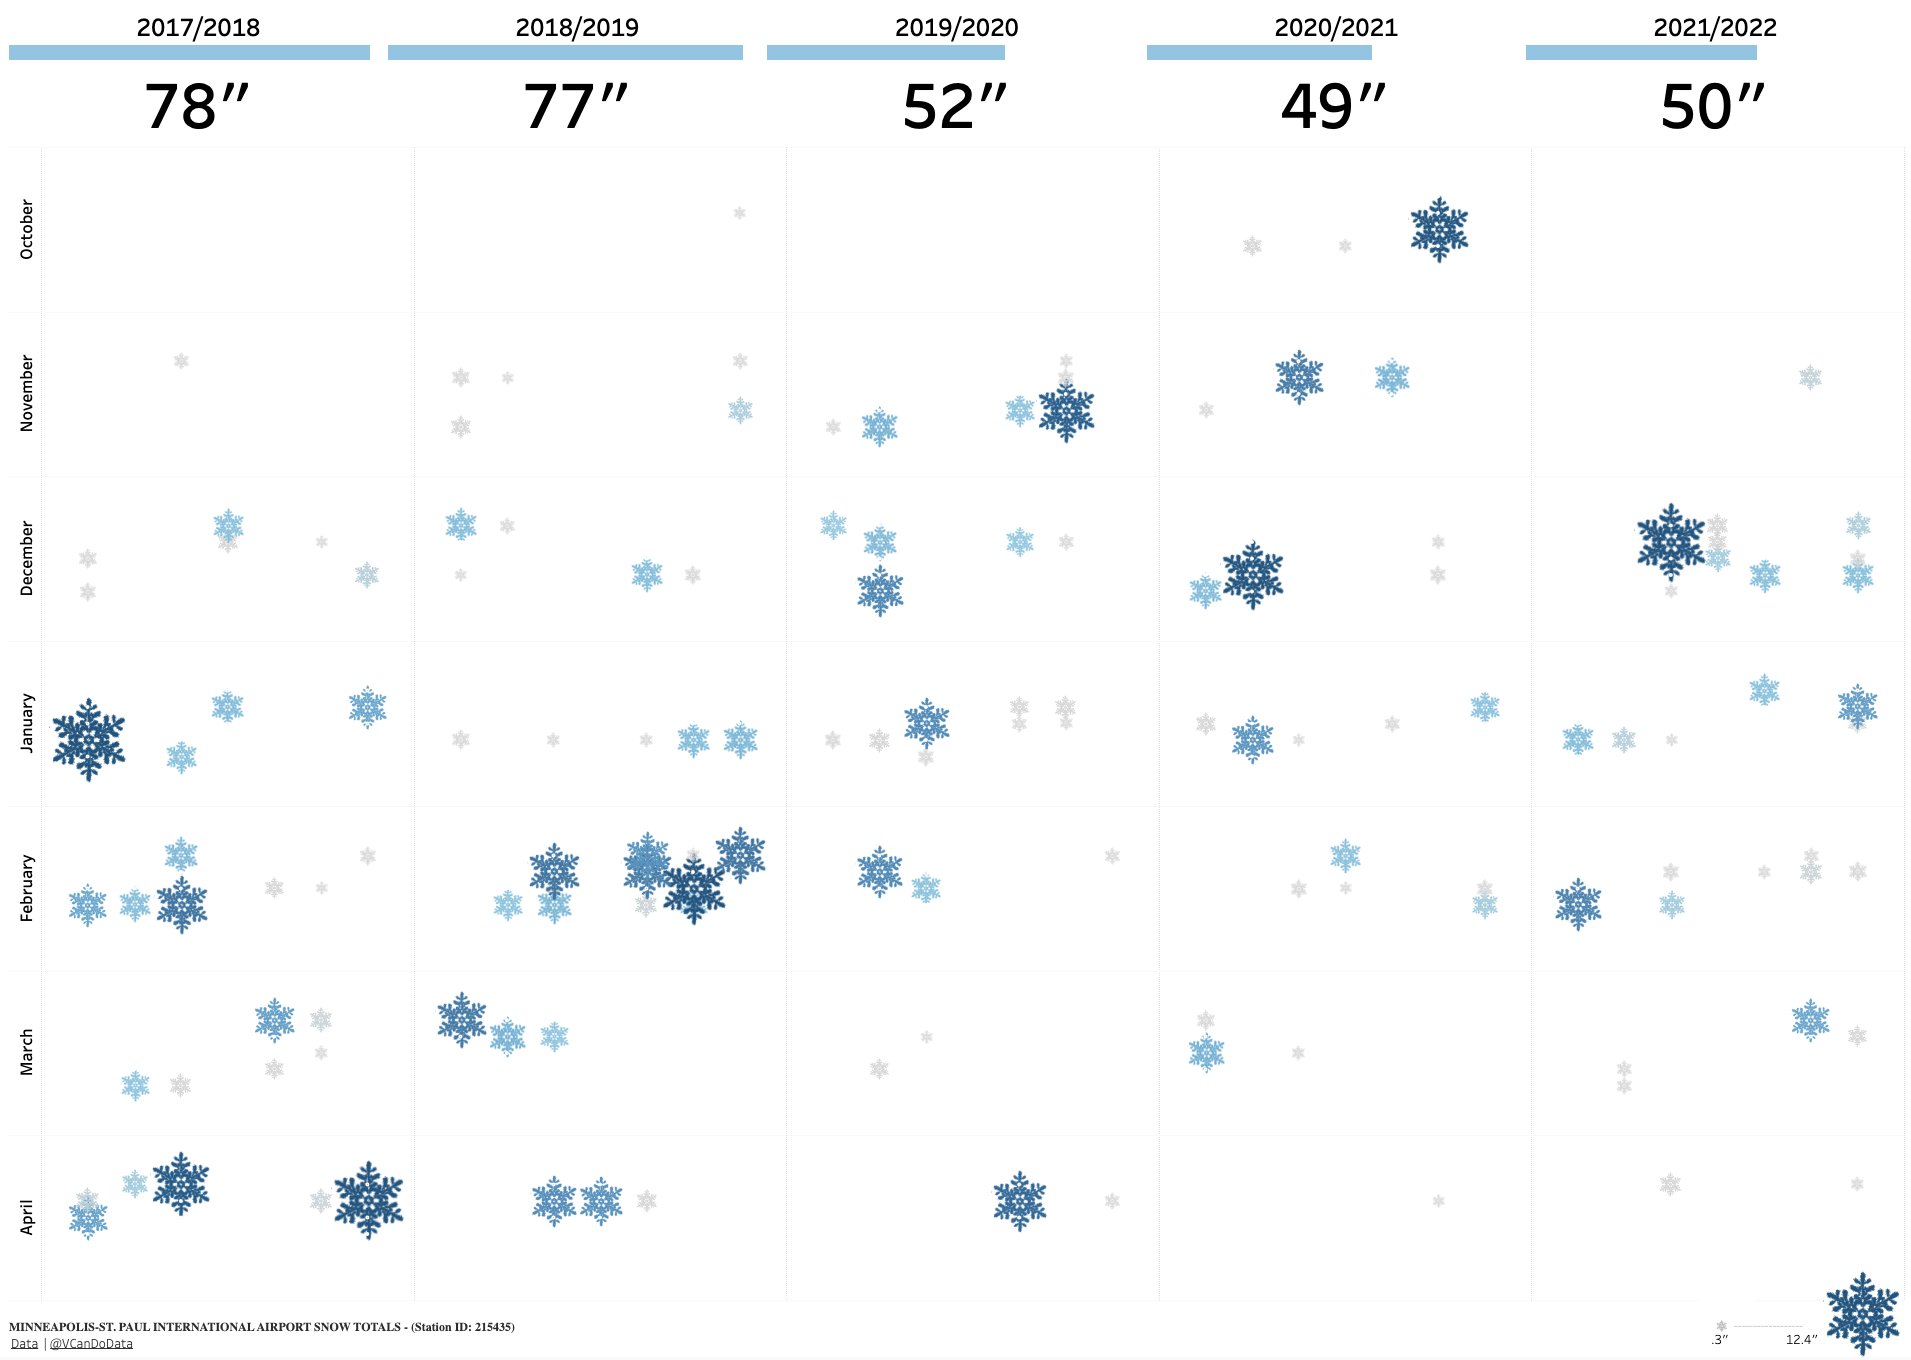
~50 inches is about average here. 2017-2019 were above average winters.
[deleted] t1_iv891h3 wrote
[deleted]
lambofgod0492 OP t1_iv7voyl wrote
CollisionCourse321 t1_ivarvug wrote
At first I hated the organization of this but after 20 seconds I took kindly to it. Well done.
lambofgod0492 OP t1_ivau9fd wrote
I know it's hard to read. I wanted to make it look like falling snow visually so had to compromise on clarity Lol
Identd t1_iv8thlb wrote
Ok you should post snowfalls for the 91 Halloween
ARoodyPooCandyAss t1_iva29ac wrote
2018/2019 was fucking brutal. Cold as hell in Feb and clearly lots of snow..
40for60 t1_ivau7rs wrote
If you laid in average temp and daylight hours this would be a great chart for people who ask when to visit. I usually suggest March because there is snow, the coldest days are mostly past us and the days are getting longer.
Nicely done and unique.
matttproud t1_ivan4wt wrote
Here I was thinking Minnesota would be one of the last places facing water security issues …
Should_be_less t1_ivaspdc wrote
This a cool idea to display the data, but as-is it's nearly impossible to read. Like, if I want to follow a year's snowfall chronologically, should I be zig-zagging down a column or reading in short rows right-to-left?
At least for an English-speaking audience, I think it would work better if you flipped it so the years are rows and the months are columns, and keep all the snowfalls for one month in the same row. Will be a lot more intuitive to read right-to-left. To keep it from getting too spread out, you'd have to do something like spacing the snowflakes in their month based on % of the way through the month rather than having space for 30 individual days. Kinda like this, but not shit because you actually know how to use Tableau.
[deleted] t1_ivb1zv8 wrote
[removed]
Bradrelliott t1_ivcan65 wrote
swimbikebadger t1_ivd3x8r wrote
The great blizzard of ‘91. Take a seat kids.

hepakrese t1_iv9xkhy wrote
This graph is impossible to read.