 [OC] How to spot misleading charts? I would like to hear your opinion on the subject, also any tips design-wise?
Stannic50 t1_iziugzl wrote
Reply to comment by MrMitchWeaver in [OC] How to spot misleading charts? I would like to hear your opinion on the subject, also any tips design-wise? by dark_o3
If the units are different, then you can't plot the two series with only one vertical axis and so of course two different axes is ok.
But this example is in percent, so the units are not different. If the purpose is to compare the magnitude of series A to the magnitude of series B, then they should use the same axis. Using different axes would be acceptable if the purpose were to compare change over time (or whatever horizontal axis is) within A to change over time within B (as you might with, say, % of state budget spent on education vs % graduation rate). In this case, it's useful to zoom in on each series independently so the change over time is maximized.
MrMitchWeaver t1_iziwq8f wrote
If the unit is the same but the magnitude is very different it does not make sense to use the same axis.
Take housing growth YoY, unemployment, loan delinquency, labor force participation rate, yield curve.
These are all expressed in percentage points but they have wildly different ranges and magnitudes. It would make no sense to use one single axis for two or more of those.
As I said in my first comment. If the series justify the double axis chart it makes sense to use it.
Creator needs to be honest and consumer needs to be vigilant. Same as it ever was.
marsman t1_izj00gg wrote
>These are all expressed in percentage points but they have wildly different ranges and magnitudes. It would make no sense to use one single axis for two or more of those.
And importantly, there is the potential for trends to be highlighted by that sort of chart that wouldn't otherwise be visible, and that are accurately reflected in the data (so its not a manipulation).
Stannic50 t1_izjhx9m wrote
I agree. That's what I meant by "change over time within A/B." If the purpose of a graph is to show whether dogs or cats are preferred, then there should be a single % of households containing [pet] axis so the magnitude of the values can be directly compared. Whereas if the purpose is to show the effect of the 2008 recession on pet ownership, it may be more appropriate to have two separate axes so the magnitude of the change in values can be compared.
MrMitchWeaver t1_iziz6qy wrote
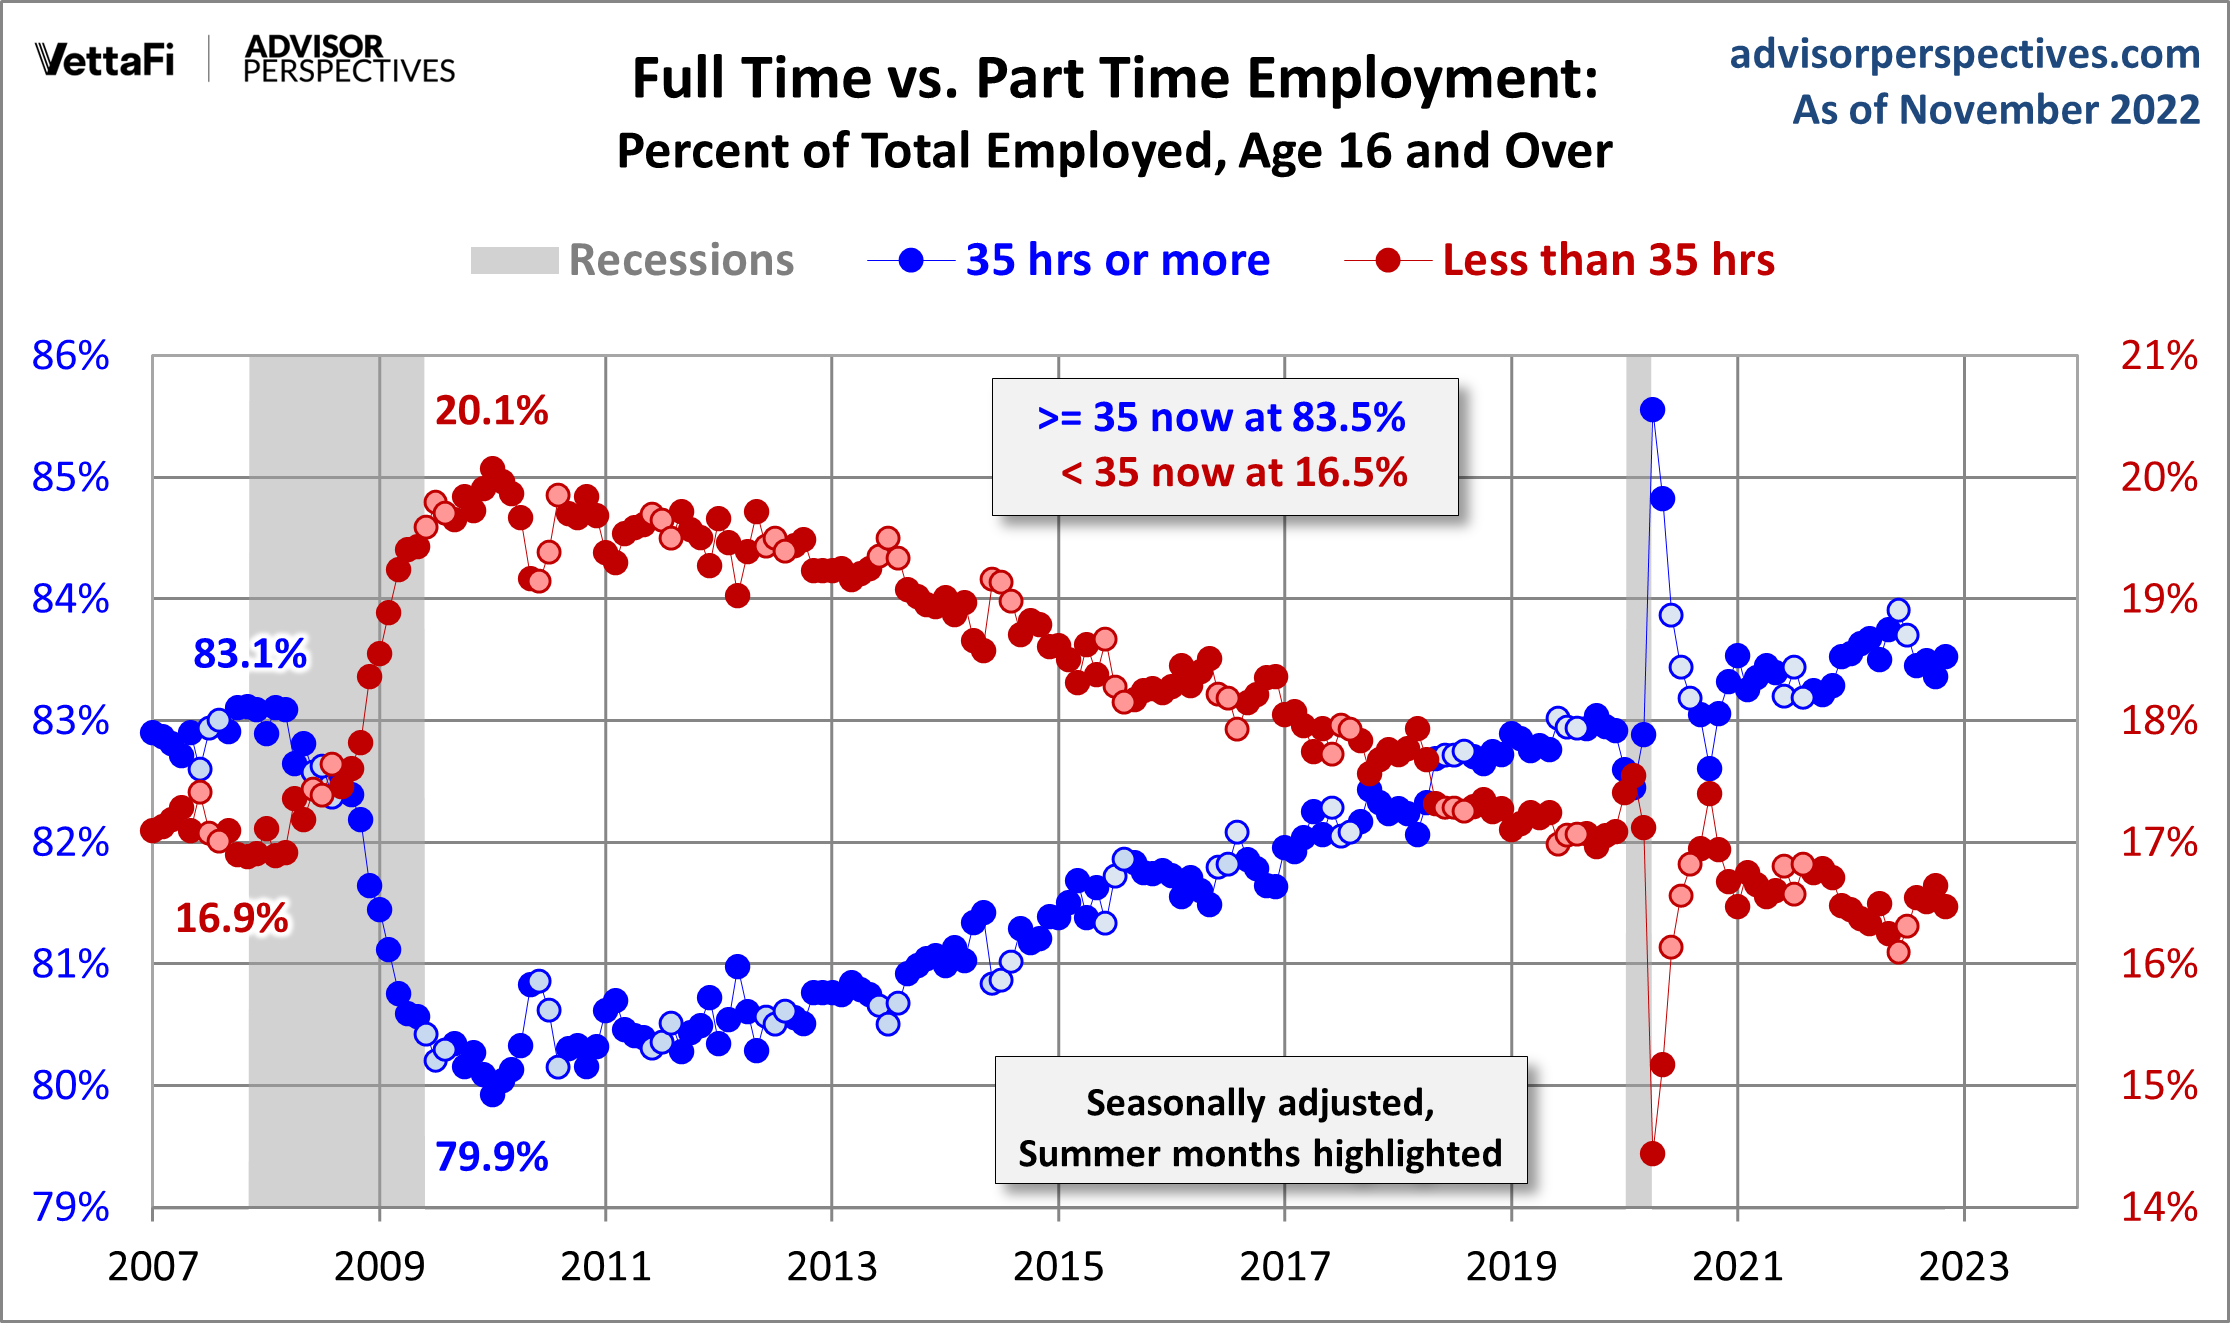
Here's a great example I just ran into https://www.advisorperspectives.com/images/content_image/data/a3/a310f2c1738037eb2e55deb0b7a54134.png
bosschucker t1_izkebe4 wrote
I don't really love this example tbh. look at where the lines cross at 82.5% - what does that tell you? the viz is clearly saying that there is some significance to 82.5% of workers being full time by nature of having that be where the lines meet - but what does it actually mean? you could move the axes so that the lines cross at whatever arbitrary point you want. if your viz is going to imply that a certain data point is significant, I think it actually should be
MrMitchWeaver t1_izklsm9 wrote
I think it's a good example insofar it shows two series that need different axes of the same unit and are absolutely correlated. I'm not talking about the data itself. It's more a response to the other person's points.
Viewing a single comment thread. View all comments