Comments
woodzy_mtb OP t1_izm0j9y wrote
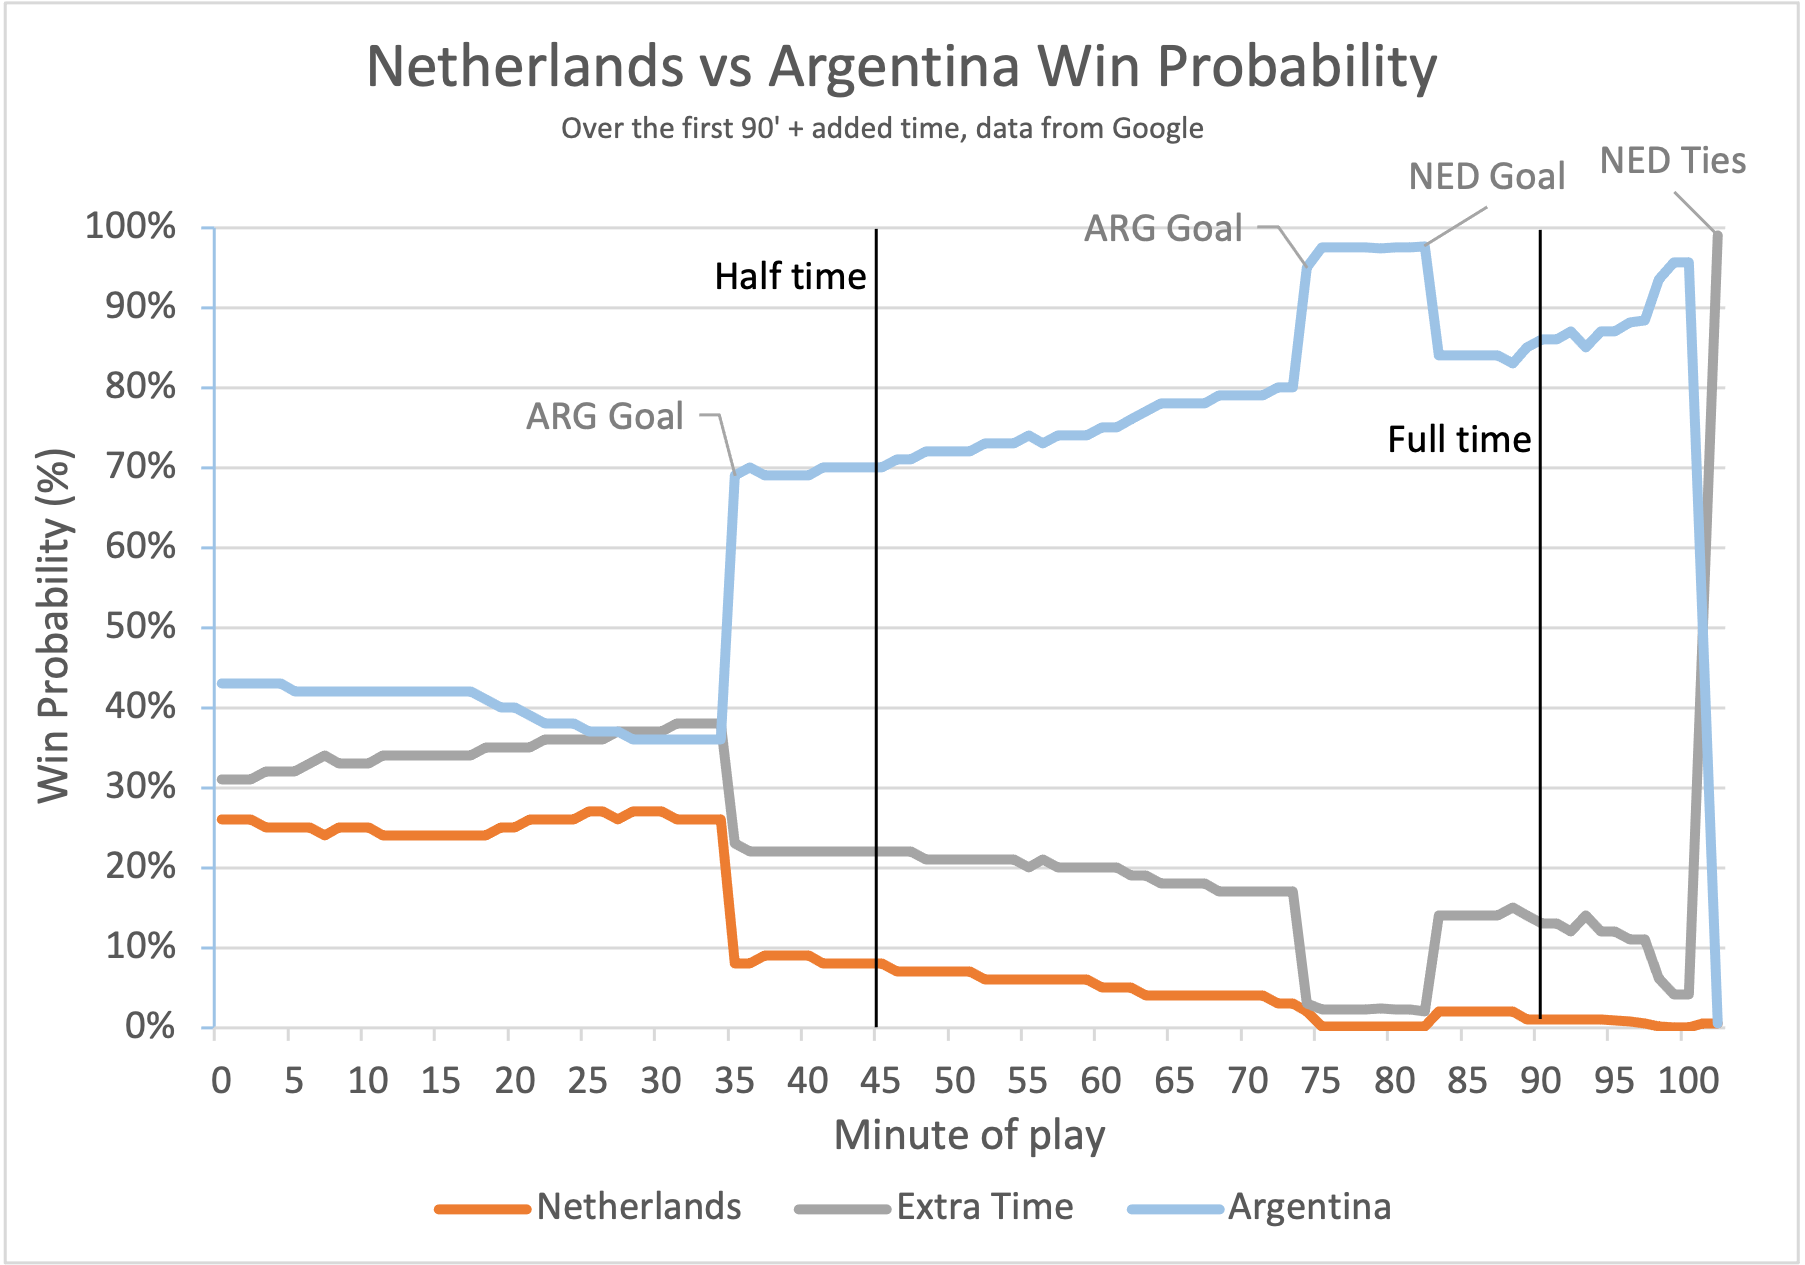
The grey line is extra time! So when the Netherlands score with 8 minutes left the probability of the game going to extra time jumps to near 99%.
Edit: Original comment asked about the sharp cross of lines at the end.
TrustM3ImAnEngineer t1_izm0mjj wrote
My bad. I’m going to go ahead and delete my comment
BlueSpiritBoi t1_izmt85s wrote
Nah it was a good question
DrinkinDoughnuts t1_izoc39w wrote
I don't really understand this chart. Both teams have a higher chance of losing or tying going into the game than winning it?
Strength-Speed t1_izprng7 wrote
So a tie in regulation is just over 30% probability before the game starts, that is pretty interesting.
LegHole3 t1_izq3uli wrote
Bookies cut?
DrinkinDoughnuts t1_izrq8tx wrote
You can bet on that too.
Kind of similar with 0 on roulette, but here the chance of tie is bigger.
woodzy_mtb OP t1_izlnkau wrote
Source: Google win probability data from the World Cup data card in Google search results. Info about the data here.
Tool: Used Puppeteer javascript library to scrape the data from Google each minute of the game then Excel to create the chart.
To clarify the legend, orange is prob. of a Netherlands win in regular time, blue is an Argentina win, gray is prob. of ending in a tie and heading to extra time.