Submitted by declanrjb t3_zt0p72 in dataisbeautiful
Comments
declanrjb OP t1_j1c2cy9 wrote
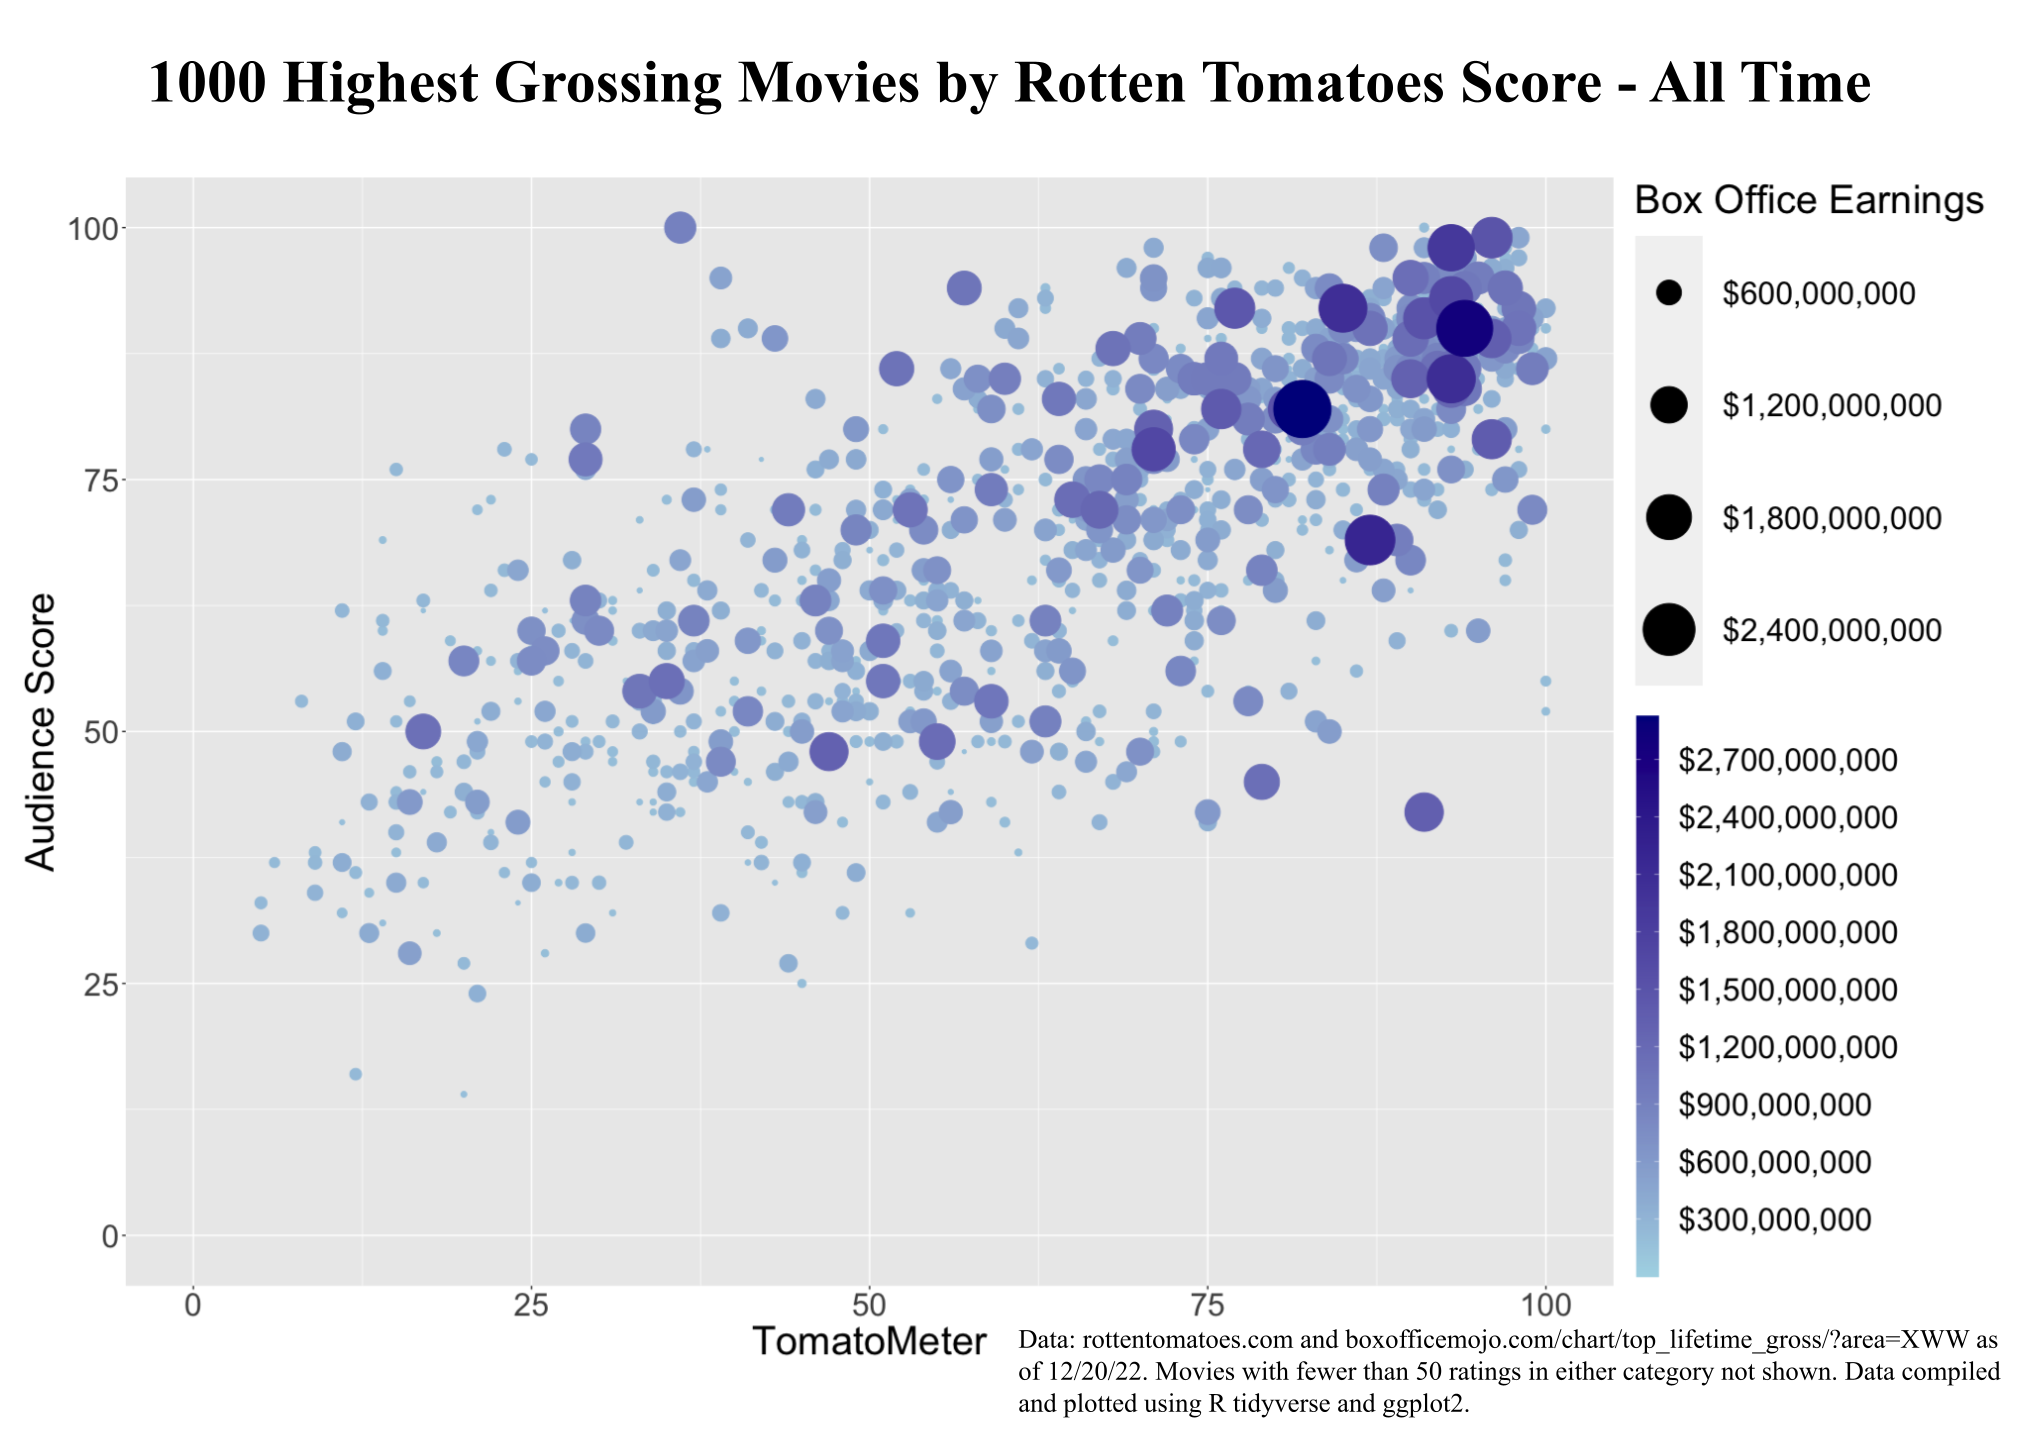
The two giant ones in the upper right quadrant are Avatar and Avengers: Endgame, respectively, if that's what you mean. I was trying to make it interactive at one point so you could hover over a dot for movie title, but I'm just a hobbyist and I haven't figured out how to do it yet. I'd be happy to post the full csv at some point though so people can look up individual titles.
declanrjb OP t1_j1c46ih wrote
Here's the full csv from the last run if anyone's interested, the script and plot I used are also on GitHub
https://github.com/declanrjb/rotten-tomatoes/blob/main/ratings_all.csv
[deleted] t1_j1djvwl wrote
[removed]
bagelslice2 t1_j1c8gcb wrote
He said what are the outliers with a big difference between audience and tomato score. It seems like you just focused on “big blue dots” and posted a link to a list. I’d also like to know, thanks
declanrjb OP t1_j1cdqu9 wrote
Oh, gotcha. This is the equivalent of back of the napkin math I did in five minutes just now, so it might not be complete, but looks like these are the top 15 with the highest absolute value differences between Audience Score and Tomato Meter. Hope that helps
https://github.com/declanrjb/rotten-tomatoes/blob/main/highest_differences.png
Sweaty-Willingness27 t1_j1cfxx5 wrote
Ran it through a Perl script and these are the top ten differences:
​
| Title | audience score | tomato meter |
|---|---|---|
| The Battle at Lake Changjin | 100 | 36 |
| Dolittle | 76 | 15 |
| Maleficent: Mistress of Evil | 95 | 39 |
| I Now Pronounce You Chuck & Larry | 69 | 14 |
| Bad Boys II | 78 | 23 |
| Gone in 60 Seconds | 77 | 25 |
| Patch Adams | 73 | 22 |
| Ace Ventura: When Nature Calls | 72 | 21 |
| Grown Ups | 62 | 11 |
| Venom 2018 | 80 | 29 |
notbad2u t1_j1dtyjl wrote
The very highest grossing movies.
declanrjb OP t1_j1b0b6h wrote
Data: rottentomatoes.com and boxofficemojo.com/chart/top_lifetime_gross/?area=XWW as of 12/20/22. Movies with fewer than 50 ratings in either category not shown. Data compiled and plotted using R tidyverse and ggplot2.
Setty4U t1_j1b6uz5 wrote
Good data, but I hate that the top four are inverted.
[deleted] t1_j1c9hvl wrote
[deleted]
jbobeffrey t1_j1b93vv wrote
Cool! Can someone smarter than me tell me how much those correlate based on the chart?
TheBlueChewy t1_j1bds80 wrote
It looks like very few mistakes are made when choosing a high ranked movie on Rotten Tomatoes as big ranked movies there mean big box office earnings. Also, only a few low ranked movies on RTomatoes had a big box office earning.
bewitchedbumblebee t1_j1c0knp wrote
I wonder if the box office earnings are adjusted for inflation.
A movie that sold a million tickets in 1982, and a movie that sold a million tickets in 2020 each sold a million tickets, but the 2020 movie's box office earnings will be significantly larger.
declanrjb OP t1_j1c2nap wrote
The data set I used in this case is not adjusted, if it were the list would be quite different (Gone with the Wind and A New Hope would still be at the top by a lot), so that would be an interesting one to run through at some point.
Query_Prone t1_j1djfeq wrote
Is this an interactive model that can be published?

mjnuismer t1_j1bmzom wrote
I wanna know what those outlier big blue dots are. Big differences between Audience score and Tomato score.