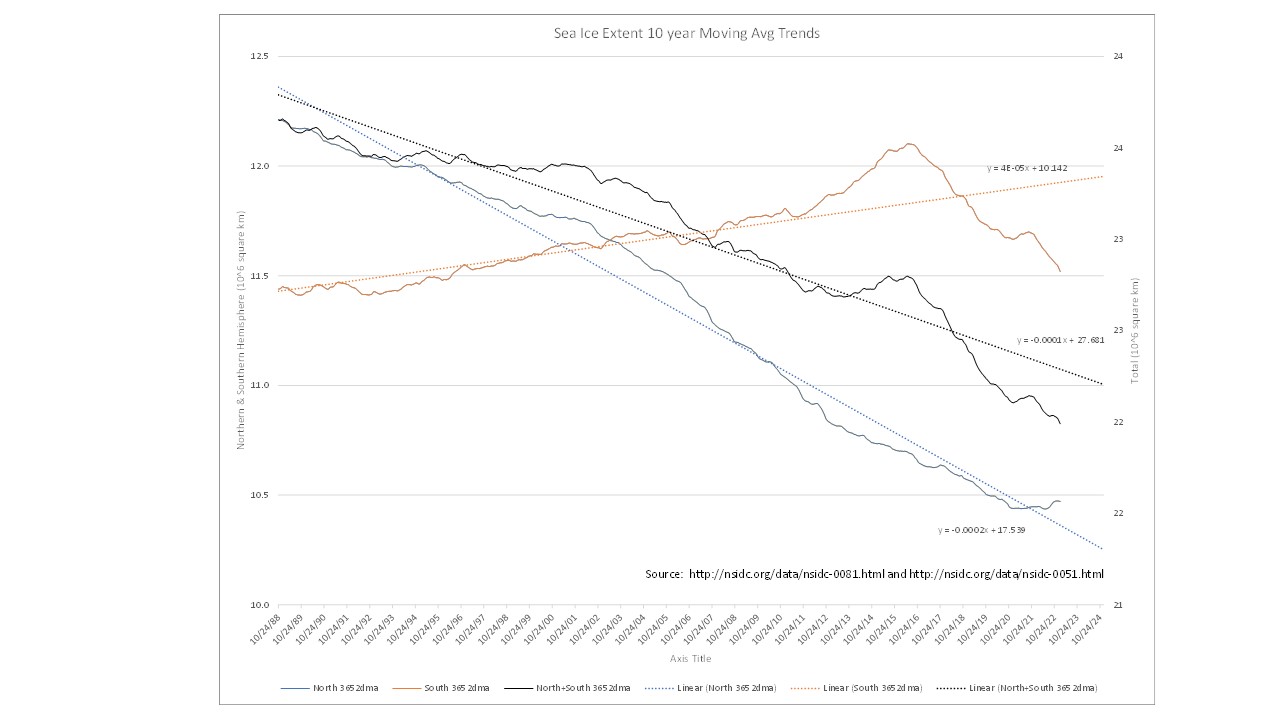
 [OC]10 year moving average sea ice extent.
Submitted by Snoo_94483 t3_10o9kff in dataisbeautiful
mediandude t1_j6oukan wrote
Reply to comment by Snoo_94483 in [OC]10 year moving average sea ice extent. by Snoo_94483
10-year moving average is off due to leap years. That skews the average. Looking at the graph, the variance of the northern hemisphere is up to 150k and some few % of that might be the leap year effect. 12-year average is also closer than 10-year average to the solar cycle 11.2 year cycle. Nitpicking, but why not?
Snoo_94483 OP t1_j6oym5q wrote
That’s wrong. It’s a 3652 day moving avg, so that takes care of the leap year. Even if it were an issue, and it’s not, it at most could impact it at most a small percent of 1/3652.
I would be interested to see some data showing a correlation between the solar cycle and global warming metics. Last month had a higher monthly total than any month in the previous cycle.
mediandude t1_j6pfzlu wrote
> It’s a 3652 day moving avg, so that takes care of the leap year.
No, it doesn't.
A 1461 day moving average would. Or a multiple of that.
> Even if it were an issue, and it’s not, it at most could impact it at most a small percent of 1/3652.
A day of difference would be a day of difference. During the fast changing season periods the change is 2x the annual average change. High daily averages top 100k per day. Divide that by 10x and you get 10k per day - against the max variance of 150-200k. That is significant.
> I would be interested to see some data showing a correlation between the solar cycle and global warming metics.
You were looking at it. The northern hemispheric sea ice extent data shows a quite clear 22 year full cycle (or two individual 11-year cycles).
Snoo_94483 OP t1_j6phxv3 wrote
Your first paragraph is simply wrong. The chart looks identical with 9,10 or 11 year moving averages. Data source is there if you want to plot it up yourself.
You can’t see a 22 year year cycle on a 10 year moving average.
Viewing a single comment thread. View all comments