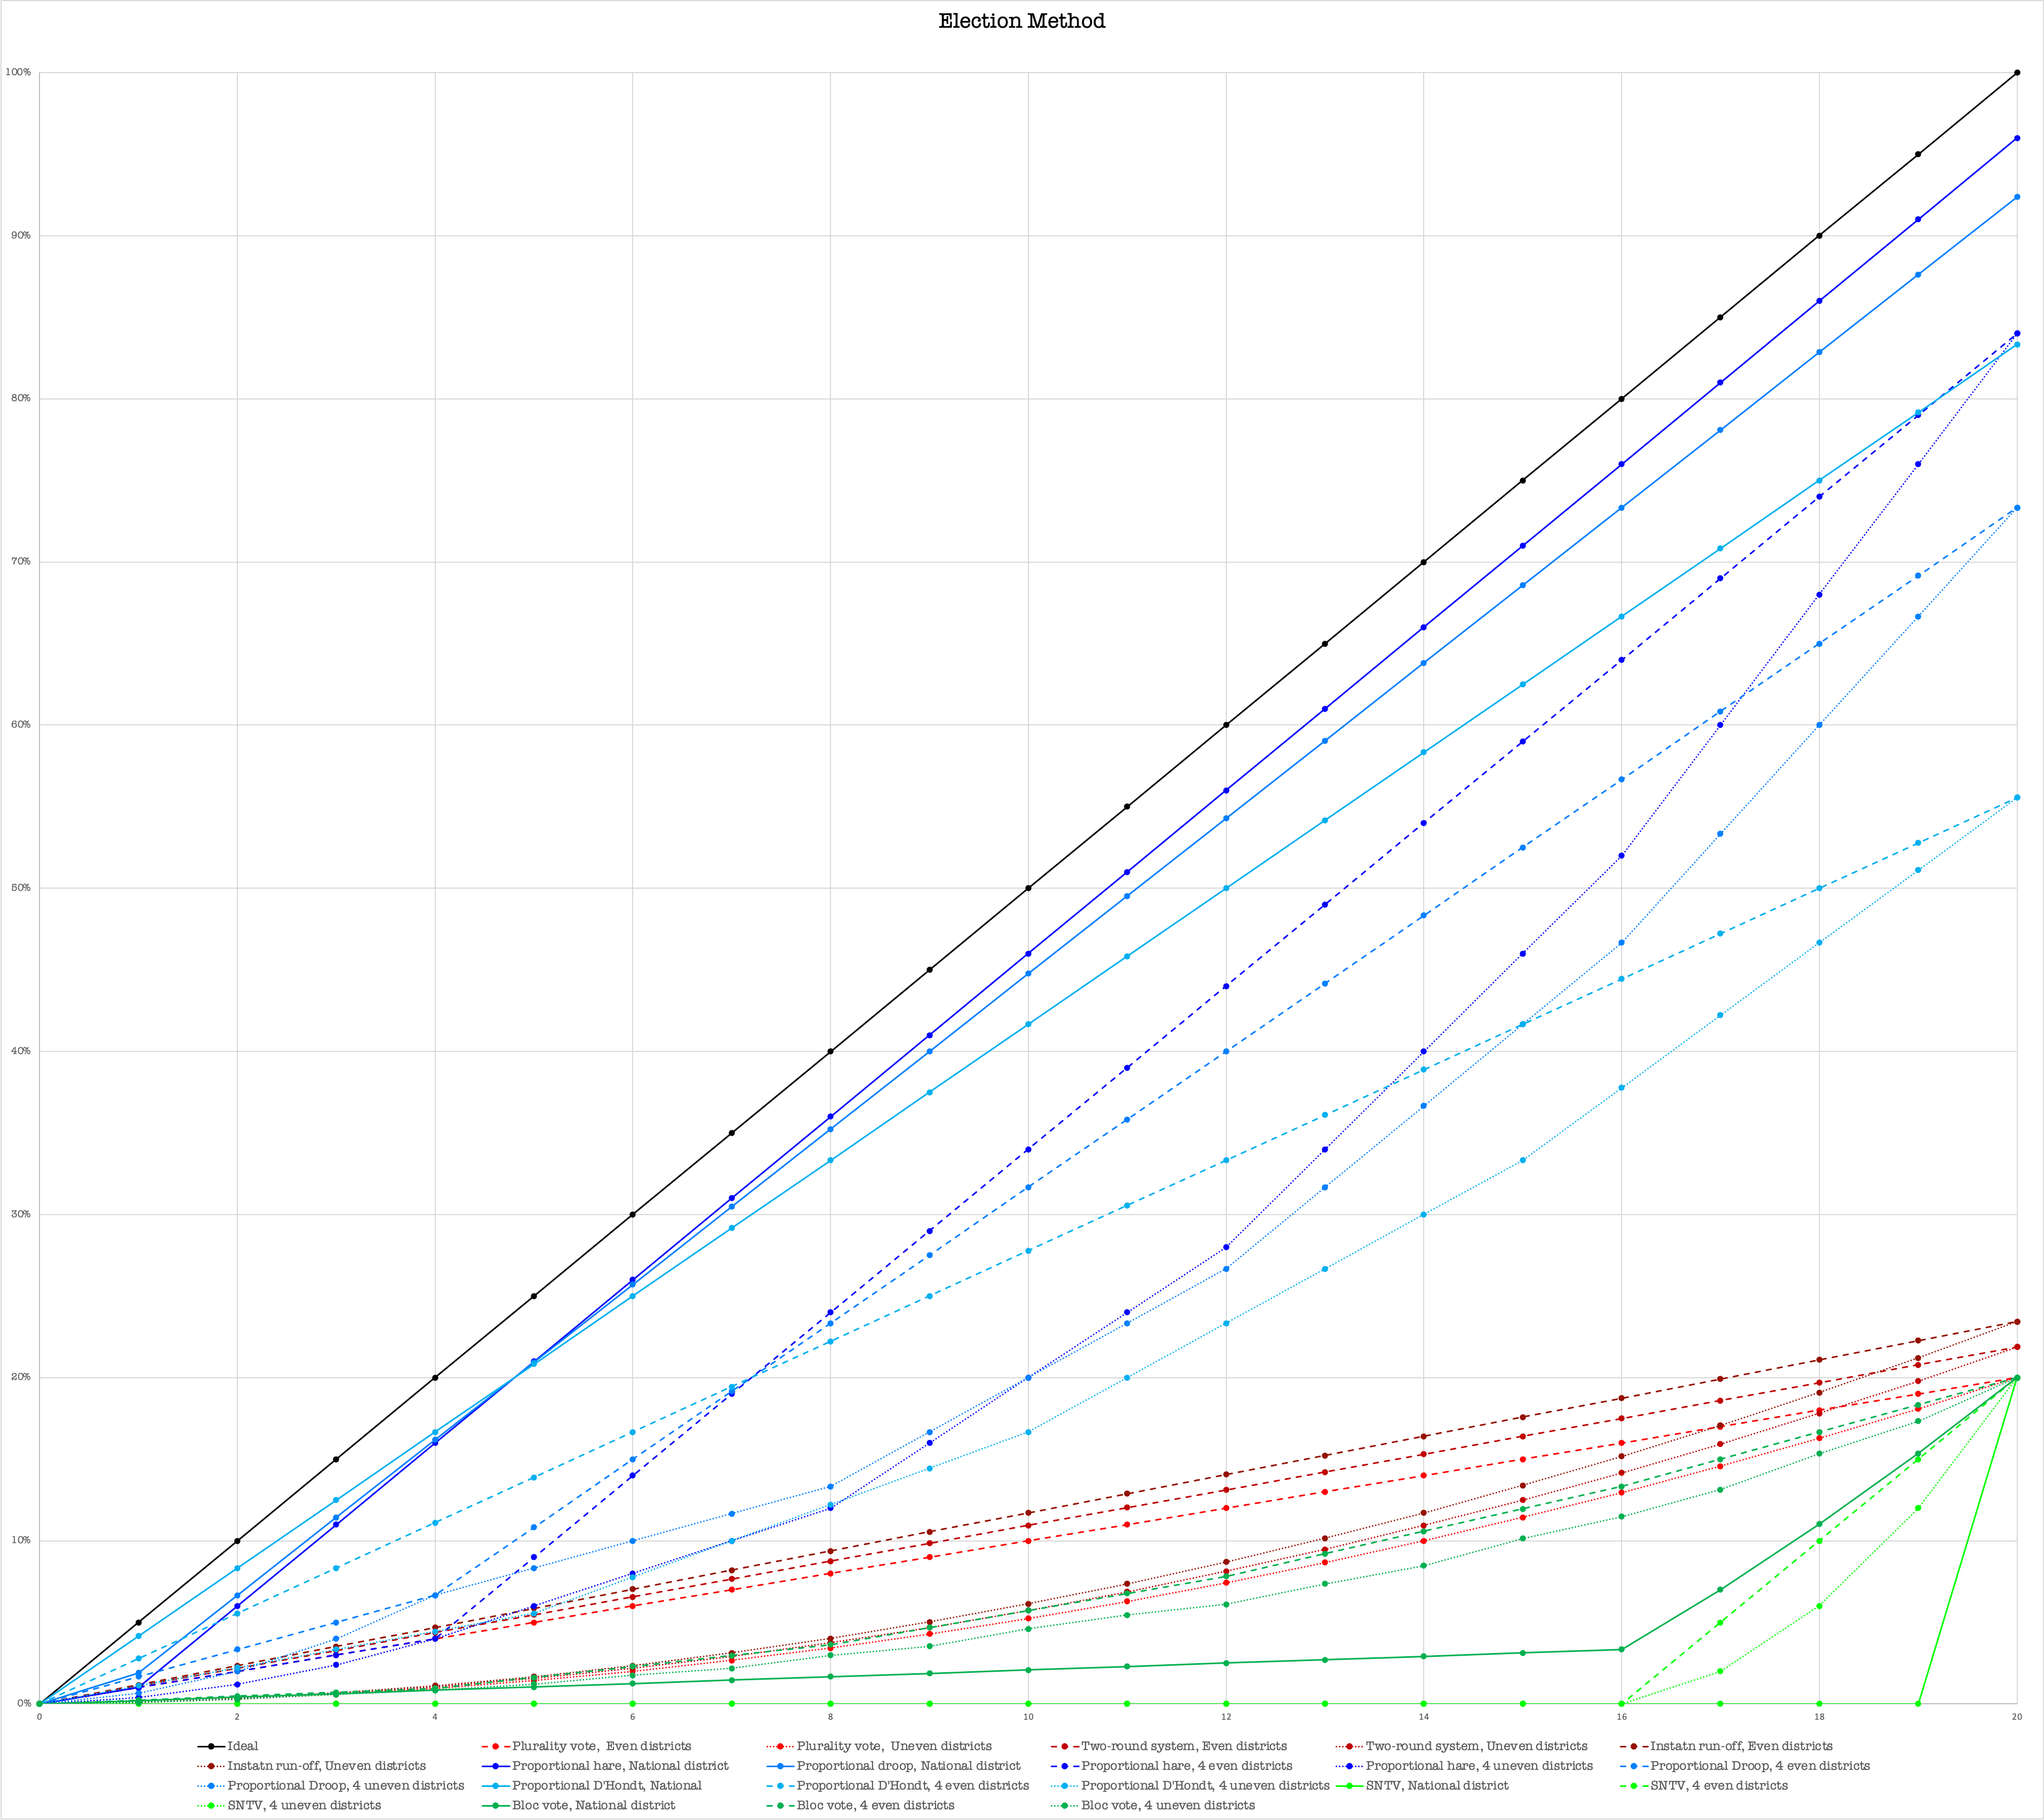
Since the required share of votes depends on the number of contesters per seat I arbitrarily choose it to be 5 contester/seat.
Multi-member districts (for green and blue systems) are of a magnitude of 5 and 'Uneven" means they have a different number of voters in a ratio 1:2:3... 19:20 or 1:2:3:4 for multi-member districts.
Also, since the Two-round system and Alternative vote allow 2nd and even 2nd last preferred candidate to win the graph shows an average preference, rather than sheer share of vote.
I'd love to engage with the data here, but I'm not sure what the X or Y axes represent given they're missing their labels. I'm assuming that the Y axis is percentage of the vote, but X is more confusing. Is the X axis meant to represent the number of seats won assuming there are 20 seats available?
You need to rethink your presentation of this. I'm sure it's interesting but the presentation sucks. No axes labels, no obvious assumptions up. Really, I should be able to look at this and discern what's going on and what the important conclusions are without going to the comments to see if there's a bunch of explanation. If I have to read a paper to understand this, it's should be posted in r/researchpapersarebeautiful
Glif13 OP t1_j6hu3f0 wrote
Sources:
https://en.wikipedia.org/wiki/Hare_quota
https://en.wikipedia.org/wiki/Droop_quota
https://en.wikipedia.org/wiki/Block_voting
https://en.wikipedia.org/wiki/Plurality_voting
https://en.wikipedia.org/wiki/Two-round_system
https://en.wikipedia.org/wiki/D%27Hondt_method
https://en.wikipedia.org/wiki/Instant-runoff_voting
https://en.wikipedia.org/wiki/Single_non-transferable_vote