 [OC] Country’s GDP as a percentage of United States GDP between 1992 and 2022
Submitted by Porchie12 t3_1044si2 in dataisbeautiful
Porchie12 OP t1_j32qaal wrote
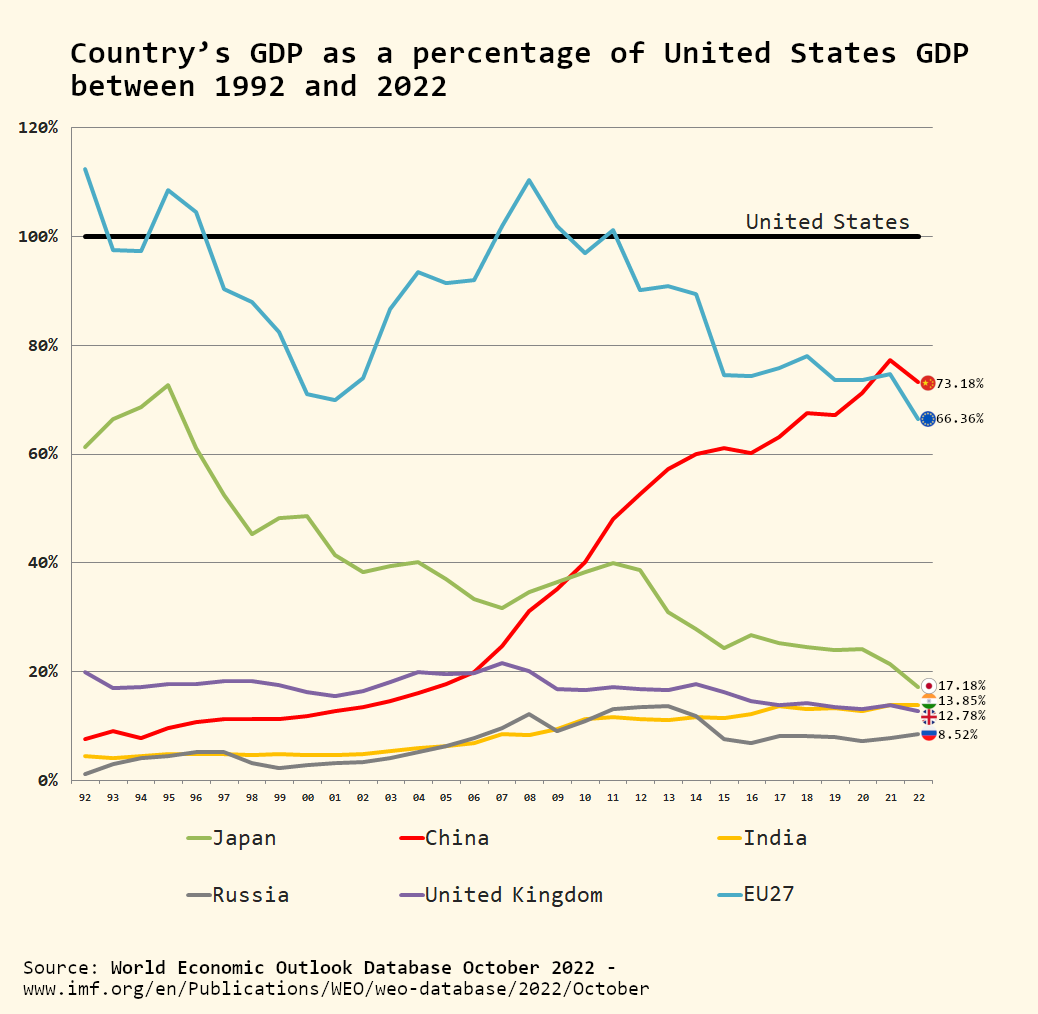
This chart shows the GDP of China, Japan, India, Russia, the UK and the EU as a percentage of American GDP in each year between 1992 and 2022.
​
The EU27 figure includes GDP of all current 27 member states, regardless of their membership in the Union in the past.
​
Source: https://www.imf.org/en/Publications/WEO/weo-database/2022/October
​
Tools Used:Microsoft Excel, GIMP
Viewing a single comment thread. View all comments