Submitted by dynosaur7 t3_109fjtp in dataisbeautiful
Comments
Futuur t1_j4psr6l wrote
Interesting! You can use Futuur, another prediction market, to have another data layer:
https://futuur.com/
[deleted] t1_j3xyi8h wrote
[removed]
Born_Room7048 t1_j3xyn6x wrote
Why is headline always lower than core over the last few months?
​
Also where is this from?
dynosaur7 OP t1_j3xzj79 wrote
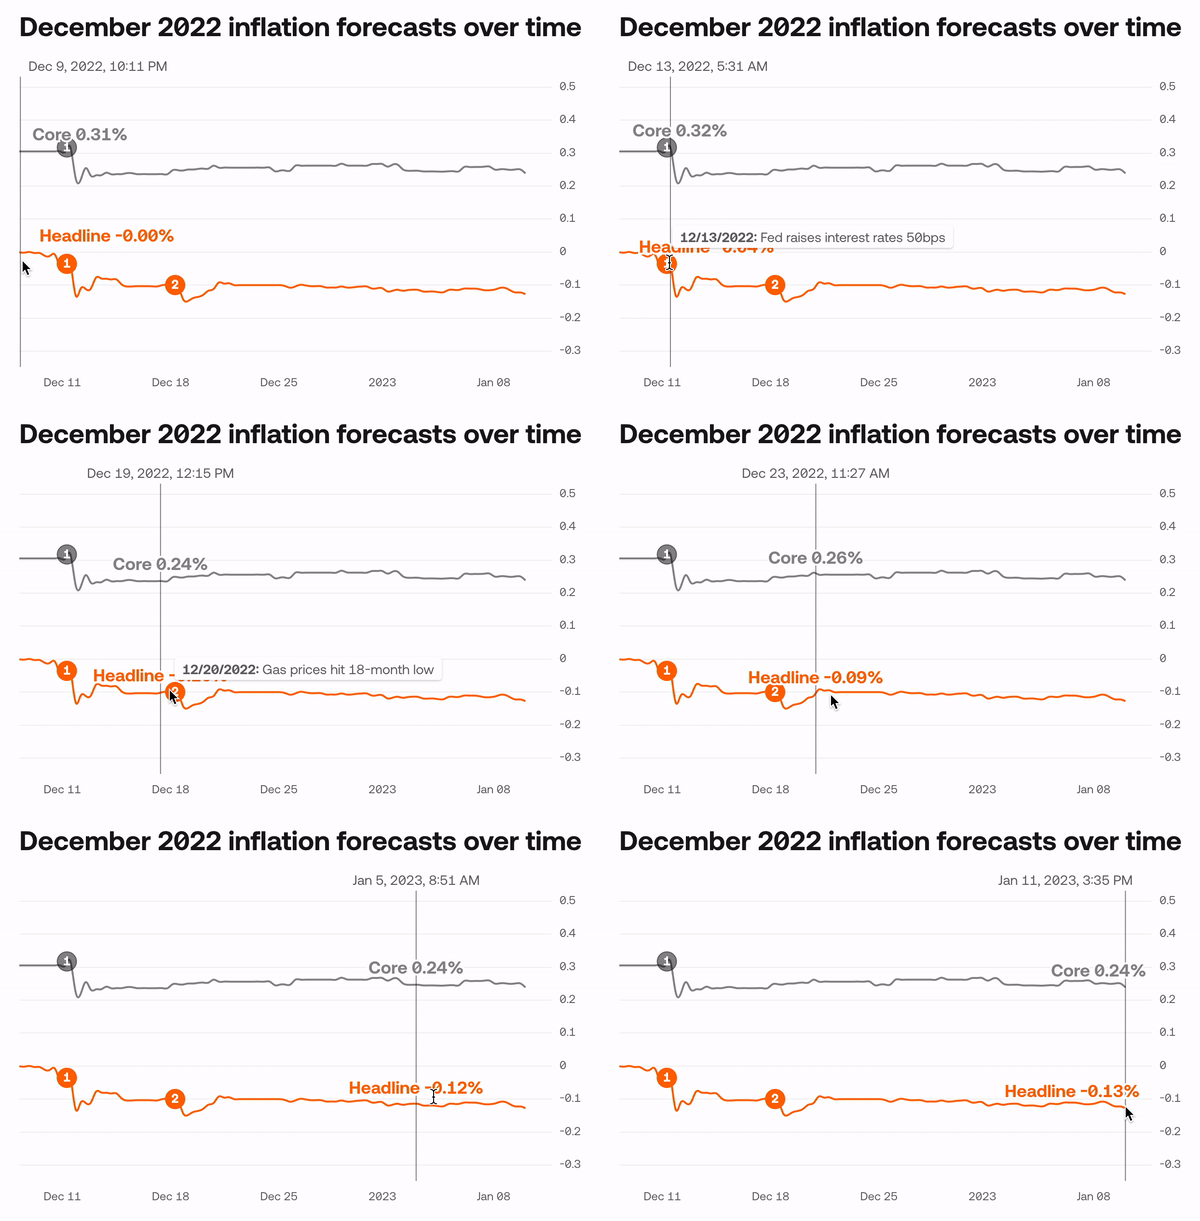
Headline is lower than Core right now because energy prices are dropping more than other categories. (Core doesn't include energy)
The data is from kalshi.com and you can view an interactive version at kalshi.com/forecasts/inflation
Name_Found t1_j3y1s80 wrote
Headline has big emphasis on energy which has fallen heavily due to overestimation of demand I believe so more supply less demand lowered prices so headline went down. However core doesn’t include energy and included more lagging behind items such as food which will benefit from lower diesel prices but haven’t reflected fully yet.
I’m pretty stupid so I probably missed something important but that’s about the general idea.
liortulip t1_j3xzzjf wrote
This is really cool! It's interesting that you can attribute those spikes to specific events.
[deleted] t1_j3y00yv wrote
[removed]
pantaloonsofJUSTICE t1_j3y6kmz wrote
Is this month over month % increase? It can’t be annual (which is sort of the default), so what is it?
dynosaur7 OP t1_j3y8hen wrote
That's right, it's month % increase. The current forecast for year-over-year is 6.4% headline
[deleted] t1_j3y8rvz wrote
[removed]
[deleted] t1_j4162e9 wrote
[removed]

dynosaur7 OP t1_j3xxqhq wrote
There’s a lot of speculation about what December’s inflation is going to be, leading up to the BLS’s announcement on Thursday. I used market data from Kalshi, a regulated prediction market, to chart and annotate how the forecast has changed over time.
Data: kalshi.com/events/CPI-22DEC
Tools: React, VisX
Link to interactive content: kalshi.com/forecasts/inflation
Disclaimer: I am employed by Kalshi, but all the data I used to create this visualization is publicly accessible on the website.