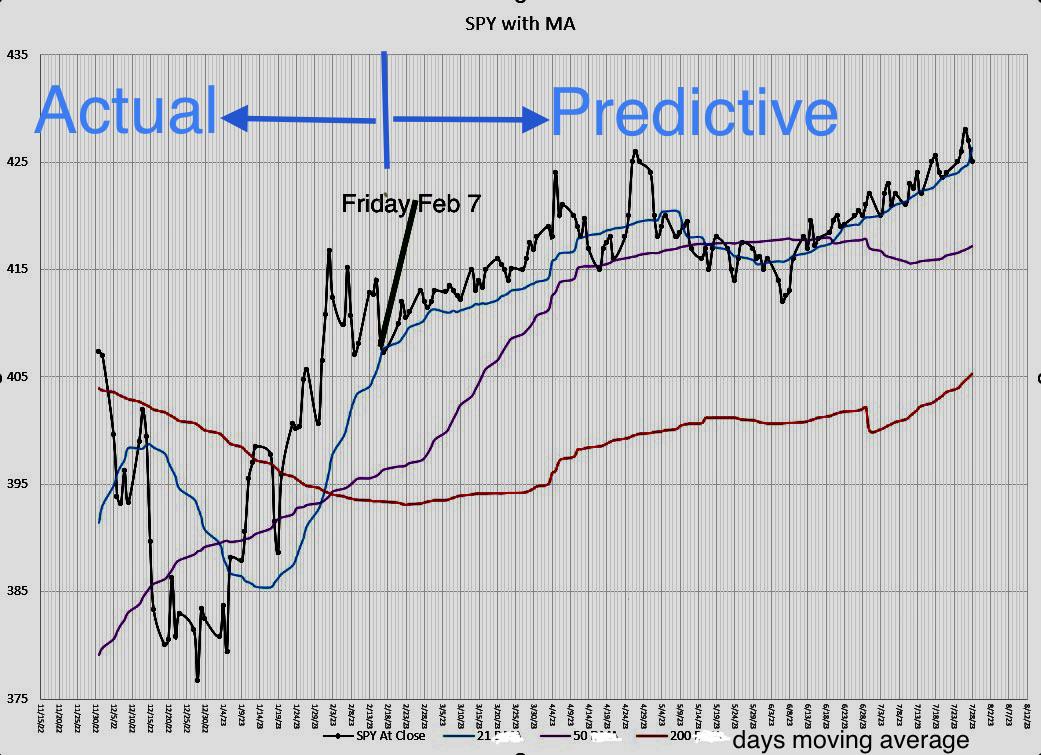
 Everyone is making predictions…why not then? SPY will stay between $407 and $427 until August 2023. Yes, I love crayons 🖍️
Dry_Job_1084 OP t1_j97mynj wrote
Reply to comment by 69420ballspenis in Everyone is making predictions…why not then? SPY will stay between $407 and $427 until August 2023. Yes, I love crayons 🖍️ by Dry_Job_1084
I tried plotting that scenario but it didn’t work from a technical perspective from where it is at the moment. It would be something like a black swan event that would make the 50 day moving average sink quickly under the 200 day moving average when it just crossed it going upwards a couple of weeks ago. So maybe if Putin does use nuclear weapons that could happen, or if the U.S. president dies, or the debt ceiling drama escalated and US defaulting on its debt. That last one will not come until June-July. That’s why my graph shows a dip in those months.
69420ballspenis t1_j97psp1 wrote
Fed minutes Monday (likely up and down and no real movement) PCE comes out Friday. PCE comes in hot and we start to break 4050 on SPX. It doesn’t take a black swan event for institutions to capitulate when data shows companies don’t deserve 20-30x PE ratios. Golden cross is a dumb indicator in and of itself when economic data suggest there’s reason to be speculative of a bull market.
KutteKiZindagi t1_j99kexu wrote
> technical perspective
technical analysis is astrology for dumb investors. at best, it's a red herring used by large funds to create bag holders.
I am not saying you are wrong or right and FWIW you could be right. But it's not because of TA
Dry_Job_1084 OP t1_j9a90hw wrote
I’m looking at SPY data starting in February 1993 through today. TA and the 50, 200 day moving average “theory” has held up over the last 30 years. So maybe now it breaks, who knows! But I don’t think so.
BurningThad t1_j9atjqx wrote
... you realize those lines changes to best fit the trendline...
Because of that, it's always going to fit historical values... Whether it will 100% predict tomorrow is a guess... But know this, once tomorrow happens , the MA of the past weeks will change to fit lol.
Hence the term, "moving average"... when there's no data to plot, it can't tell you much. You can only speculate.
If you don't understand what I mean, maybe look at how it's calculated.
Dry_Job_1084 OP t1_j9cxwhv wrote
Yes, I understand how it’s calculated. I obviously wrote the same formulas used to continue calculating it adding in the predicted future daily values. Maybe, you don’t understand how it’s calculated and you don’t understand that a whole week of trading is only 1/10 of the 50 day moving average. So one week or one day can’t skew it much.
69420ballspenis t1_j9gdk3y wrote
I think so. On account of it did. Back to 390s before end of first week of March. And here we are.
Dry_Job_1084 OP t1_j9gl9m8 wrote
Not $390s. It’s barely under $400. But if you are so sure it is going to $390, you should buy puts. $390 strike expiring this Friday is going for $0.70. Super cheap. Go for it!
69420ballspenis t1_j9hvck3 wrote
Isn’t just under 400 in the 390s? I can tell you it sure as shit isn’t 407-427. Sorry your ego is hurt. I’ll just continue to hold my July 405 puts I bought back in the 410s because I’m not a broke gambling regard and can afford theta.
Dry_Job_1084 OP t1_j9jb9zi wrote
That is definitely better than 0DTEs. Good job! You should double down on that play. I have a well seasoned ego, not easily bruised, no worries.
Viewing a single comment thread. View all comments