BurnerAcc2020
BurnerAcc2020 t1_je94azh wrote
Reply to comment by [deleted] in We’re halfway to a tipping point that would trigger 6 feet of sea level rise from melting of the Greenland Ice Sheet by Bored-sideline
It still takes centuries for the Thwaites ice to enter the sea after the ice shelf collapses. One of the scientists who spends months at a time on that glacier literally said she would only see some of it disappear in her lifetime.
BurnerAcc2020 t1_jcxkzqe wrote
BurnerAcc2020 t1_jbochod wrote
Reply to comment by AntiTyph in Global food consumption alone could add nearly 1 °C to warming by 2100. Seventy five percent of this warming is driven by foods that are high sources of methane (ruminant meat, dairy and rice). by Plant__Eater
I mean, SSP1 results in a slight decline in population at the end of the century, so it being similar to no-growth scenario isn't too surprising. However, the more important part is that SSP1 already assumes that the current dietary patterns (the focus of the paper) are not sustained, and pretty much all the interventions they recommend are implemented.
https://www.sciencedirect.com/science/article/pii/S0959378016300681
> In comparison, the SSP1 scenario features a sustainable land transformation with comparatively little pressure on land resources due to low population projections, healthy diets with limited food waste, and high agricultural productivity.
> Population growth and food demand is a strong driver of future CH4 emissions across the SSPs. It is thus not surprising that CH4 emissions are highest in the SSP3 baseline and lowest in SSP1.
So, it's unfortunate that some people appear to read this paper as if it discovers a completely new source of warming. It doesn't; it's more like a reanalysis of the existing projections narrowly focused on a specific hypothetical & set of interventions.
BurnerAcc2020 t1_jba251t wrote
Reply to comment by SemanticTriangle in Global food consumption alone could add nearly 1 °C to warming by 2100. Seventy five percent of this warming is driven by foods that are high sources of methane (ruminant meat, dairy and rice). by Plant__Eater
That example is nearly 7 years old, my dude, and says nothing about 4 C.
Here is something from the same year which does, though.
https://link.springer.com/article/10.1007/s41247-016-0013-9
And here is something much more recent.
https://www.sciencedirect.com/science/article/pii/S2666049022000524
Better get on with the program.
BurnerAcc2020 t1_jba1rzw wrote
Reply to comment by Earthling1a in Global food consumption alone could add nearly 1 °C to warming by 2100. Seventy five percent of this warming is driven by foods that are high sources of methane (ruminant meat, dairy and rice). by Plant__Eater
The figure in the headline already refers to SSP3, which assumes end-of-century population of 12 billion. According to the current population projections, that's nearly 2 billion too high.
BurnerAcc2020 t1_j8rc44f wrote
Reply to comment by SaxManSteve in New study shows Acceleration of global sea level rise imminent past 1.8℃ planetary warming by 9273629397759992
So, my original response got eaten by reddit's spam filter (probably because I included the same link twice, but you'll never know with these things) and I'm going to have to try again, for posterity.
By now, many of the points I made in that comment were already made by others, like Spratt & Dunlop possessing very limited credibility, or that feedbacks are both slow enough relative to human emissions to operate over many centuries and are already accounted for in the IPCC reports to a great extent. In fact, even IPCC report #4 - which was first published in 2007 - already had a whole chapter on carbon cycle and other feedbacks.
https://www.ipcc.ch/site/assets/uploads/2018/02/ar4-wg1-chapter7-1.pdf
The feedbacks which are more difficult to account for, like permafrost, still have an impact that's a fraction of human emissions.
I would simply like to reiterate the points around "crippled agriculture, food shortages", etc. It would appear true if you just look at the climate projections and assume that they'll apply to the current amount of land used to grow food. What that assumption misses is that the amount of land won't stay the same: the IPCC assumes that as the population grows and climate change accelerate, people will simply clear-cut down more, more and more forest to the tune of hundreds of millions of hectares and grow crops on that land. Compare the population/GDP graph from my earlier comment (not linking it again in case it also triggers the bot) with the land use graph, where cropland extent and forested land extent simply go in opposite directions in each scenario - to the point where a scenario with 12 billion people cuts down nearly 600 million hectares. This is also why food supply projections for 2050 look like this and like this, and not like what most people assume when only looking at yield reduction projections or the talk of instability.
And finally, yes, we should move to a non-growth and sustainable system. The thing is, it looks like we may well get away with not doing that in this century, even if the cost will simply be paid by the ecosystems and future generation. That is the position of the scientists who collectively wrote the "ghastly future" paper, and at this point, the counterarguments (whether optimistic or the opposite) appear increasingly strained.
BurnerAcc2020 t1_j8n1rxa wrote
Reply to comment by PsychologicalLuck343 in New study shows Acceleration of global sea level rise imminent past 1.8℃ planetary warming by 9273629397759992
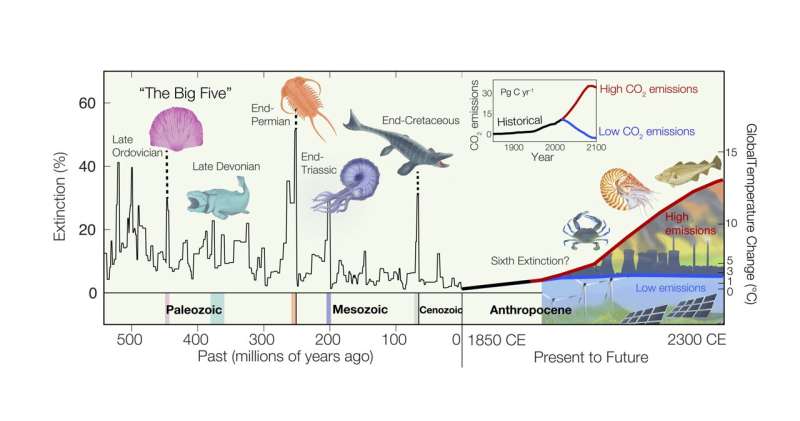
Well, don't be lazy and read the rest then. Off you go! I have no real obligation to write more and repeat what those references already explain. Your last sentence is rendered irrelevant by my very first link. My last link is the graph from that exact same Princeton study and it's the one which shows extinction levels not matching the Big Five extinctions until at least 2300. (You would have seen it if you read the entire article.)
BurnerAcc2020 t1_j8mpps3 wrote
Reply to comment by HenryGreatSageJunkie in New study shows Acceleration of global sea level rise imminent past 1.8℃ planetary warming by 9273629397759992
You know that those Chinese nuclear plants amount to 5% of their electricity needs, right? If anything, the US already has about twice as many reactors as China and more than anyone else in the world - yet those are just 18% of the US' electricity.
A fully/mostly nuclear grid in the US is always presented as if it's a matter of building just a few more reactors, when the reality is that without a major reduction to the current levels of electricity consumption, you would have to build (and operate) a few hundred more of them. If you think that oil and gas industry is the only reason the US did not build 300/400 more nuclear power plants by now...well, OK, I guess.
BurnerAcc2020 t1_j8mbcxg wrote
Reply to comment by kytopressler in New study shows Acceleration of global sea level rise imminent past 1.8℃ planetary warming by 9273629397759992
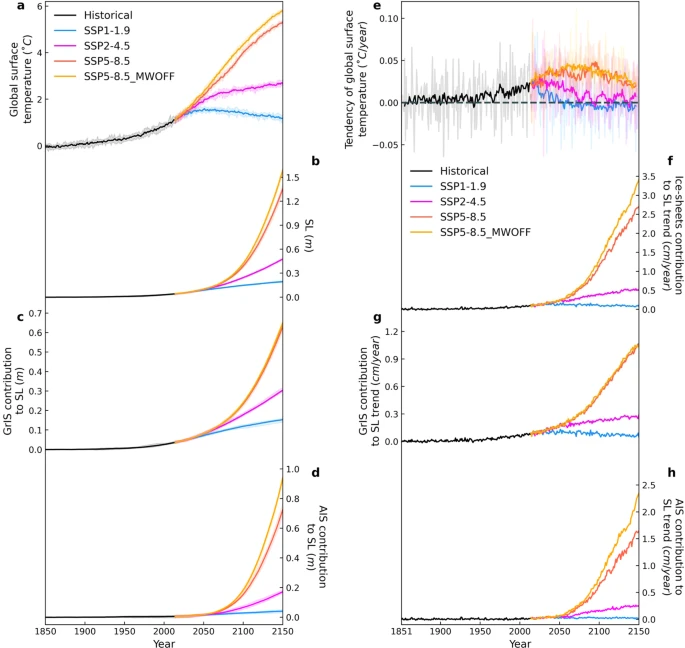
No, I have to say that you misread the paper here.
The first sentence you quoted discusses estimates for the 21st century (i.e. up until 2100), and it explicitly refers to AIS (Antarctic ice sheet) contribution. The actual paper's estimate in the second sentence is by 2150, not 2100, and it refers to ice-sheet contributions - i.e. Antarctic ice sheet and Greenland.
You need to look at Figure 3 of that paper. You'll see that in d), their estimate for AIS alone under SSP5-8.5 (the orange line - the higher yellow line is a more primitive simulation of the same scenario they run for comparison) is about 0.2 m by 2100 and 0.7 m for 2150.
BurnerAcc2020 t1_j8maaiv wrote
Reply to comment by SaxManSteve in New study shows Acceleration of global sea level rise imminent past 1.8℃ planetary warming by 9273629397759992
> which only speeds up the process of system wide ecological collapse that will absolutely lead to dramatic population contraction in the near future.
Not according to even the scientists who otherwise agree that the future would be "ghastly", though?
https://www.frontiersin.org/articles/10.3389/fcosc.2020.615419/full > It is therefore also inevitable that aggregate consumption will increase at least into the near future, especially as affluence and population continue to grow in tandem (Wiedmann et al., 2020). Even if major catastrophes occur during this interval, they would unlikely affect the population trajectory until well into the 22nd Century (Bradshaw and Brook, 2014). Although population-connected climate change (Wynes and Nicholas, 2017) will worsen human mortality (Mora et al., 2017; Parks et al., 2020), morbidity (Patz et al., 2005; Díaz et al., 2006; Peng et al., 2011), development (Barreca and Schaller, 2020), cognition (Jacobson et al., 2019), agricultural yields (Verdin et al., 2005; Schmidhuber and Tubiello, 2007; Brown and Funk, 2008; Gaupp et al., 2020), and conflicts (Boas, 2015), there is no way—ethically or otherwise (barring extreme and unprecedented increases in human mortality)—to avoid rising human numbers and the accompanying overconsumption. That said, instituting human-rights policies to lower fertility and reining in consumption patterns could diminish the impacts of these phenomena (Rees, 2020).
Not to mention the more mainstream views like those of the IPCC (look at their population graphs).
BurnerAcc2020 t1_j8m9ike wrote
Reply to comment by PsychologicalLuck343 in New study shows Acceleration of global sea level rise imminent past 1.8℃ planetary warming by 9273629397759992
There's no need to think about it because it's not going to happen in the first place.
Studies show that even warming of over 4 degrees by the end of the century (which is higher than what is now expected) reduces ocean biomass by about 20%.
https://www.nature.com/articles/s41467-020-15708-9
>Significant biomass changes are projected in 40%–57% of the global ocean, with 68%–84% of these areas exhibiting declining trends under low and high emission scenarios, respectively.
>
>...Climate change scenarios had a large effect on projected biomass trends. Under a worst-case scenario (RCP8.5, Fig. 2b), 84% of statistically significant trends (p < 0.05) projected a decline in animal biomass over the 21st century, with a global median change of −22%. Rapid biomass declines were projected across most ocean areas (60°S to 60°N) but were particularly pronounced in the North Atlantic Ocean. Under a strong mitigation scenario (RCP2.6, Fig. 2c), 68% of significant trends exhibited declining biomass, with a global median change of −4.8%. Despite the overall prevalence of negative trends, some large biomass increases (>75%) were projected, particularly in the high Arctic Oceans.
>
>Our analysis suggests that statistically significant biomass changes between 2006 and 2100 will occur in 40% (RCP2.6) or 57% (RCPc8.5) of the global ocean, respectively (Fig. 2b, c). For the remaining cells, the signal of biomass change was not separable from the background variability.
https://www.nature.com/articles/s41558-021-01173-9
>Mean projected global marine animal biomass from the full MEM ensemble shows no clear difference between the CMIP5 and CMIP6 simulations until ~2030 (Fig. 3). After 2030, CMIP6-forced models show larger declines in animal biomass, with almost every year showing a more pronounced decrease under strong mitigation and most years from 2060 onwards showing a more pronounced decrease under high emissions (Fig. 3). Both scenarios have a significantly stronger decrease in 2090–2099 under CMIP6 than CMIP5 (two-sided Wilcoxon rank-sum test on annual values; n = 160 for CMIP6, 120 for CMIP5; W = 12,290 and P < 0.01 for strong mitigation, W = 11,221 and P = 0.016 for high emissions).
>
>For the comparable MEM ensemble (Extended Data Fig. 3), only the strong-mitigation scenario is significantly different (n = 120 for both CMIPs; W = 6,623 and P < 0.01). The multiple consecutive decades in which CMIP6 projections are more negative than CMIP5 (Fig. 3b and Extended Data Fig. 3b) suggest that these results are not due simply to decadal variability in the selected ESM ensemble members. Under high emissions, the mean marine animal biomass for the full MEM ensemble declines by ~19% for CMIP6 by 2099 relative to 1990–1999 (~2.5% more than CMIP5), and the mitigation scenario declines by ~7% (~2% more than CMIP5).
In fact, it was estimated a year ago that a mass extinction in the oceans would happen only if the emissions somehow continue to shoot straight up for 300 years. In fact, even that scenario, which would result in about ~12 degrees of warming, would "only" drive about 40% of the species in the ocean extinct. -
BurnerAcc2020 t1_j3mha38 wrote
Reply to comment by Kalapuya in Deep overturning circulation collapses with strong warming, which could cause a "disaster" in the world's oceans. by sibti
Yes, which is why I brought it up in the first place. My point was that merely looking at the publication date would have shown that the link with the exceprt is too old to have anything to do with the OOP post outside of studying similar subject matter, yet the other commenter did not even do that and thought the excerpt was from the present study.
BurnerAcc2020 t1_j3mfuss wrote
Reply to comment by corgibutt19 in Deep overturning circulation collapses with strong warming, which could cause a "disaster" in the world's oceans. by sibti
If what that paper means by "worst-case" is the same as the standard definition in this literature (hard to tell because of the paywall), then it essentially assumes continual acceleration of human contributions to warming, which is extremely implausible. (There are even some papers which argue that there are not enough fossil fuels to enable those rates of warming in the first place.) The rate of warming which is actually projected nowadays (see the last link in that comment) is well below that which is considered in the paper, and was found by the other papers I linked to have limited effects on at least the Atlantic circulation.
BurnerAcc2020 t1_j3mey0t wrote
Reply to comment by CornucopiaOfDystopia in Deep overturning circulation collapses with strong warming, which could cause a "disaster" in the world's oceans. by sibti
My cornucopian, you have repeatedly made accusations against me in this thread which were entirely based on your inability to understand what I wrote and do even the most cursory research like the clicking the OOP article or my links. If you want to see better attitude from me, how about you delete all of those comments, or edit them to acknowledge what you got wrong?
> even though conditions well before a complete collapse would still be disastrous and catastrophic.
Depends on how you define these words, I guess. A rule of thumb, though: they wouldn't have led with an impact which occurs in 2300 in their headline if they were able to prove something truly dramatic in our lifetimes.
For the record, there actually was one relatively recent peer-reviewed paper which estimated that as long as the AMOC does not shut down entirely, its slowdown would be one of the few tipping points with a positive economic impact because it would help to cancel out the impacts of climate change, although those findings are far from universally accepted.
https://www.pnas.org/doi/full/10.1073/pnas.2103081118
> Slowdown of the AMOC reduces the expected SCC by 1.4% by reducing damaging warming in some countries.
> All AMOC slowdown scenarios result in a decrease in the expected SCC ranging from −0.7 to −5.7%, the latter in a scenario with a notably large two-thirds slowdown in the circulation.
(SCC stands for social cost of carbon and it's a bad thing, so it becoming lower is good.)
BurnerAcc2020 t1_j3m4s77 wrote
Reply to comment by CornucopiaOfDystopia in Deep overturning circulation collapses with strong warming, which could cause a "disaster" in the world's oceans. by sibti
That excerpt is from a study which is nearly three years old, genius. It has almost nothing to do with the study in the article, and it does not predict that there would be a collapse at that point, either, because it does not actually examine the current at all. What it does is examine the weather in the UK under the assumption it did collapse at that point. I even included the part where they say exactly that in the excerpt.
> This is a low-probability, fast and early collapse of the AMOC compared with current expectations, emphasising the idealized nature of our study and our focus on assessing impacts.
Still, next time actually click on the links. You'll learn a lot more that way.
BurnerAcc2020 t1_j3lk3pb wrote
Reply to comment by Earthling1a in Deep overturning circulation collapses with strong warming, which could cause a "disaster" in the world's oceans. by sibti
Has it?
https://www.nature.com/articles/s41558-022-01342-4
> Observed SSTs and a large ensemble of historical simulations with state-of-the-art climate models suggest the prevalence of internal AMOC variability since the beginning of the twentieth century. Observations and individual model runs show comparable SST variability in the NAWH region. However, the models’ ensemble-mean signal is much smaller, indicative of the prevalence of internal variability. Further, most of the SST cooling in the subpolar NA, which has been attributed to anthropogenic AMOC slowing, occurred during 1930–1970, when the radiative forcing did not exhibit a major upward trend. We conclude that the anthropogenic signal in the AMOC cannot be reliably estimated from observed SST. A linear and direct relationship between radiative forcing and AMOC may not exist. Further, the relevant physical processes could be shared across EOF modes, or a mode could represent more than one process. > > A relatively stable AMOC and associated northward heat transport during the past decades is also supported by ocean syntheses combining ocean general circulation models and data, hindcasts with ocean general circulation models forced by observed atmospheric boundary conditions and instrumental measurements of key AMOC components. Neither of these datasets suggest major AMOC slowing since 1980, and neither of the AMOC indices from Rahmstorf et al. or Caesar et al. show an overall AMOC decline since 1980.
The paper itself does not even find that the Atlantic meriditional overturning circulation collapses on the timescales they investigated (between now and 2300) - only the one in the Southern Ocean, by 2300, and with continually increasing emissions. Granted, earlier, some other papers which did project the collapse of the Atlantic meriditional overturning circulation - in 2200s or so, and again only under very high warming.
BurnerAcc2020 t1_j3lj8wo wrote
Reply to comment by maxToTheJ in Deep overturning circulation collapses with strong warming, which could cause a "disaster" in the world's oceans. by sibti
https://www.nature.com/articles/s41467-020-15708-9
>Significant biomass changes are projected in 40%–57% of the global ocean, with 68%–84% of these areas exhibiting declining trends under low and high emission scenarios, respectively.
>
>...Climate change scenarios had a large effect on projected biomass trends. Under a worst-case scenario (RCP8.5, Fig. 2b), 84% of statistically significant trends (p < 0.05) projected a decline in animal biomass over the 21st century, with a global median change of −22%. Rapid biomass declines were projected across most ocean areas (60°S to 60°N) but were particularly pronounced in the North Atlantic Ocean. Under a strong mitigation scenario (RCP2.6, Fig. 2c), 68% of significant trends exhibited declining biomass, with a global median change of −4.8%. Despite the overall prevalence of negative trends, some large biomass increases (>75%) were projected, particularly in the high Arctic Oceans.
>
>Our analysis suggests that statistically significant biomass changes between 2006 and 2100 will occur in 40% (RCP2.6) or 57% (RCPc8.5) of the global ocean, respectively (Fig. 2b, c). For the remaining cells, the signal of biomass change was not separable from the background variability.
https://www.nature.com/articles/s41558-021-01173-9
>Mean projected global marine animal biomass from the full MEM ensemble shows no clear difference between the CMIP5 and CMIP6 simulations until ~2030 (Fig. 3). After 2030, CMIP6-forced models show larger declines in animal biomass, with almost every year showing a more pronounced decrease under strong mitigation and most years from 2060 onwards showing a more pronounced decrease under high emissions (Fig. 3). Both scenarios have a significantly stronger decrease in 2090–2099 under CMIP6 than CMIP5 (two-sided Wilcoxon rank-sum test on annual values; n = 160 for CMIP6, 120 for CMIP5; W = 12,290 and P < 0.01 for strong mitigation, W = 11,221 and P = 0.016 for high emissions).
>
>For the comparable MEM ensemble (Extended Data Fig. 3), only the strong-mitigation scenario is significantly different (n = 120 for both CMIPs; W = 6,623 and P < 0.01). The multiple consecutive decades in which CMIP6 projections are more negative than CMIP5 (Fig. 3b and Extended Data Fig. 3b) suggest that these results are not due simply to decadal variability in the selected ESM ensemble members. Under high emissions, the mean marine animal biomass for the full MEM ensemble declines by ~19% for CMIP6 by 2099 relative to 1990–1999 (~2.5% more than CMIP5), and the mitigation scenario declines by ~7% (~2% more than CMIP5).
There was even a paper which found that even if the worst-case emission trajectory in those studies somehow continues until 2300 and gets to something like 12 degrees by 2300 (which would necessarily require the world not to collapse until then, btw, as otherwise the emissions wouldn't have anywhere to come from), about half the species in the ocean would still survive.
BurnerAcc2020 t1_j3lirk6 wrote
Reply to comment by [deleted] in Deep overturning circulation collapses with strong warming, which could cause a "disaster" in the world's oceans. by sibti
Is 2300 your definition of "swiftly"? That's when their paper actually finds that the current collapses - and not even the Atlantic one but the one in the Southern Ocean, and only under very high warming. It's actually slower than some earlier papers which did project AMOC collapse - in 2200s or so, and again only under very high warming.
As for food security, there was an interesting paper on that earlier.
https://www.nature.com/articles/s41467-020-15708-9
>Significant biomass changes are projected in 40%–57% of the global ocean, with 68%–84% of these areas exhibiting declining trends under low and high emission scenarios, respectively.
>
>...Climate change scenarios had a large effect on projected biomass trends. Under a worst-case scenario (RCP8.5, Fig. 2b), 84% of statistically significant trends (p < 0.05) projected a decline in animal biomass over the 21st century, with a global median change of −22%. Rapid biomass declines were projected across most ocean areas (60°S to 60°N) but were particularly pronounced in the North Atlantic Ocean. Under a strong mitigation scenario (RCP2.6, Fig. 2c), 68% of significant trends exhibited declining biomass, with a global median change of −4.8%. Despite the overall prevalence of negative trends, some large biomass increases (>75%) were projected, particularly in the high Arctic Oceans.
>
>Our analysis suggests that statistically significant biomass changes between 2006 and 2100 will occur in 40% (RCP2.6) or 57% (RCPc8.5) of the global ocean, respectively (Fig. 2b, c). For the remaining cells, the signal of biomass change was not separable from the background variability.
>
> ...Furthermore, under RCP8.5, consistent relationships were also observed between projected animal biomass changes and SES indicators (Fig. 3c, d), with more severe declines projected in regions with low SES. For example, Fig. 3c shows geographic patterns of projected biomass change and the human development index (HDI) within each EEZ (Fig. 3c, map), as well as the emergent relationship between them (Fig. 3c, right panel). The significant positive relationship between the HDI (Fig. 3c) and the mean rate of projected biomass change under RCP8.5 (p < 0.0001; r2 = 0.16) indicates that higher climate-driven biomass losses are projected to disproportionally occur within the EEZs of the least developed states. In addition to development status, states experiencing the greatest pressures such as high levels of undernourishment, food debt and insecurity, fishery dependency, and economic vulnerability to climate change are projected to experience the greatest losses of marine animal biomass over the coming century. These states also have the lowest ocean health scores, lowest wealth and adaptive capacity, and contribute the least to global CO2 emissions on a per capita (r2 = 0.13; p < 0.0001) and national basis (r2 = 0.1; p < 0.0001). The relationships between projected biomass and almost all SES indicators became weaker and often non-significant under a strong greenhouse gas mitigation scenario (RCP2.6; Fig. 3d).
>
> Under RCP8.5, states that currently have a higher proportion of undernourishment are projected to experience the largest climate-driven reductions in animal biomass. This relationship is troubling, given that seafood accounts for 14–17% of the global animal protein consumed by humans, but with much higher reliance in small island states, where it is vital to maintaining good nutrition and health43. Declining animal biomass within the EEZs of states that are already experiencing poor nutrition may further exacerbate these deficiencies, particularly as these states also tend to be more dependent on fisheries, have low food security and high food debts (Fig. 3d). Changes in nutrition related to declining fisheries productivity could potentially be offset by increased agricultural production, aquaculture, or modifying food distribution systems12. Yet, recent studies have also highlighted the importance of seafood as a critical source of essential micronutrients that are currently lacking in the diets of up to 2 billion people. These micronutrient deficiencies and their consequences are particularly severe in Asian and African countries, many of which are projected to experience severe reductions in marine animal biomass under RCP8.5 (Fig. 2b).
>
> To explicitly evaluate the effect of strong emission mitigation on future animal biomass, we calculated the difference in projected biomass with the strongest mitigation scenario (RCP2.6) relative to those under a worst-case scenario (RCP8.5) within each EEZ and by continent (Fig. 4). The relationship between projected biomass under RCPs 8.5 and 2.6 was positive (r = 0.53) but also suggested that the effects of strong mitigation on biomass were not purely additive: some states experienced disproportionate biomass gains (Fig. 4a, above diagonal line) or losses (Fig. 4a, below diagonal line) from strong, relative to weak mitigation. Although mitigation led to increased biomass relative to worst-case emissions within the EEZs of almost all states, it resulted in declines within the EEZs of Morocco (−1%), Chile (−10%), Spain (−12%), and Russia (−12%; Fig. 4a). Relative to a worst-case scenario, the largest biomass gains from mitigation were observed for African, Asian, and South American states, including Yemen (50%), Oman (49%), Cambodia (48%), Guinea Bissau (46%), Suriname (45%), and Pakistan (44%).
For the record, the two scenarios in that paper are "between 1.5 and 2 degrees" and "between 4 and 5 degrees" by the end of the century, and we are currently tracking for almost exactly in between the two, with a potential to get closer or even meet that former scenario.
BurnerAcc2020 t1_j3lhj4v wrote
Reply to comment by South5 in Deep overturning circulation collapses with strong warming, which could cause a "disaster" in the world's oceans. by sibti
The article says that according to their findings, the Atlantic current does not collapse even by 2300 and even under the worst-case warming (only the Southern one does by that date) but sure, go ahead.
For the record, there was a paperabout the consequences of AMOC collapse in the UK, and they found roughly 3.4 degree cooling. The collapse in rainfall was far more important. EDIT: That paper, which is the one quoted below, was published three years ago and by a completely different group of researchers. Another user thinks the excerpt below is from the study in the article for some reason.
https://www.nature.com/articles/s43016-019-0011-3
> To address these issues, we consider a well-studied tipping point; collapse of the Atlantic Meridional Overturning Circulation (AMOC). The AMOC includes surface ocean currents that transport heat from the tropics to the northeast Atlantic region, benefiting Western Europe, including the agricultural system of Great Britain. We contrast the impacts of conventional (hereafter, ‘smooth’) climate change with those of a climate tipping point involving AMOC collapse on agricultural land use and its economic value in Great Britain, with or without a technological response. > > Our climate projections span 2020–2080 and use a mid-range climate change scenario as a baseline (Fig. 1a–f; also see Methods, subsequent discussion of uncertainties such as weather variability, and sensitivity analysis in Extended Data Fig. 10; the results reported in the main text are mean effects). We take an existing simulation of the effects of AMOC collapse and treat it as a set of anomalies that can be linearly combined with the baseline (smooth) climate change scenario. We nominally assume that AMOC collapse occurs over the time period 2030–2050 (Fig. 1g–l; see Methods). This is a low-probability, fast and early collapse of the AMOC compared with current expectations, emphasising the idealized nature of our study and our focus on assessing impacts. That said, the AMOC has recently weakened by ~15% and models may be biased to favour a stable AMOC relative to observations. > > ...Our remaining scenarios impose a collapse of the AMOC over the period 2030–2050 overlaid on the smooth climate change trend. A previous study that combined a rapid AMOC collapse with future climate projections showed that temperatures will continue to rise globally, but with a delay of 15 years, while British temperatures will be dependent on the AMOC. In the present study, the AMOC collapse reverses the warming seen in the smooth climate change scenarios, generating an average fall in temperature of 3.4 °C by 2080, accompanied by a substantial reduction in rainfall (−123 mm during the growing season. > > Holding real prices constant, in the absence of a technological response (that is, irrigation), rainfall (and to a lesser extent temperature) limitation due to AMOC collapse is predicted to affect arable farming in many areas (Fig. 2f,g). The expected overall area of arable production is predicted to fall dramatically from 32 to 7% of land area (Extended Data Figs. 2 and 3). This in turn generates a major reduction in the value of agricultural output, with a decrease of £346 million per annum (Table 1), representing a reduction in total income from British farming of ~10%. The key driver of the arable loss seen across Great Britain is climate drying due to AMOC collapse, rather than cooling (Fig. 3b,c). This adds considerably to the part of eastern England that is already vulnerable to arable loss due to drying under baseline climate change (green band in Figs. 2b and 3b). Part of eastern Scotland has a potential gain in arable production suppressed by the cooling effects of an AMOC collapse (contrast Figs. 2f and 3c), but the loss of potential arable production due to cooling is small compared with the impacts of drying. However, the assumption of constant real prices is less plausible under the major global food system dislocation caused by a collapse of the AMOC. While firm estimates are not available, substantial food price increases are thought to be likely. With the physical limits imposed by AMOC collapse constraining farm production, such price increases mean that wellbeing losses may be significantly higher than those calculated here, implying that our results should be viewed as lower-bound, conservative estimates of the impacts of such a scenario. > > With a change in technology to implement sufficient irrigation from 2050, the drying effects of the AMOC collapse on arable production could be substantially offset (Fig. 2h,i). In this scenario, land area under arable production still increases from 32 to 38% by 2080, with an accompanying increase in output value of £79 million per annum (Table 1 and Extended Data Fig. 3). Nevertheless, these increases in extent and value are lower than under the second scenario where the AMOC is maintained, due to lower temperatures (contrast Fig. 2b with Fig. 2h). Furthermore, the more extreme reduction in rainfall caused by the AMOC collapse means that water required for adequate irrigation is much greater than under the scenario where the AMOC is maintained. Under the AMOC collapse scenario, 54% of British grid cells now require irrigation, with demand exceeding 150 mm in the growing season for some areas in the south and east of England (and an average demand across irrigated areas of 70 mm of extra rainfall) (Fig. 4). This would require water storage (across seasons) or spatial redistribution across the country from areas of higher rainfall in the north and western uplands of Great Britain. Irrigation costs incurred in this scenario are estimated at over £800 million per year—more than ten times the value of the arable production it would support (see Methods). So, again, irrigation costs outweigh amelioration benefits under climate change—a difference that is massively inflated by the climate tipping point of AMOC collapse. Our analysis also indicates the level of food cost increase (nearly three-quarters of a billion pounds) necessary to justify such irrigation expenditure costs.
BurnerAcc2020 t1_j3lh3nb wrote
Reply to Deep overturning circulation collapses with strong warming, which could cause a "disaster" in the world's oceans. by sibti
So, out of the 33 comments so far, literally nobody read the article far enough to realize that, according to the researchers, this only happens:
a) under worst-case warming (code word for continually increasing emissions);
b) by 2300;
c) Even then, it only happens to the Southern Meridional Overturning Circulation, and not to the Atlantic one?
r/science at its "best", as usual.
BurnerAcc2020 t1_j1lfw3o wrote
Reply to In Hokkaido, Japan's winter months, harmless underwater algae balls are protected from death by an ice shield. That shield is expected to thin thanks to global warming, causing the balls to join the list of species threatened by climate change. by MistWeaver80
Eh, the article is a real stretch. It's about research in an MDPI journal (MDPI is one of the lower-tier publishers), whose actual title is Effects of High Irradiance and Low Water Temperature on Photoinhibition and Repair of Photosystems in Marimo (Aegagropila linnaei) in Lake Akan, Japan. It only discusses climate change very obliquely.
> In the present study, as we used the dissected filamentous cells, the results might be only valid at the cellular level. In fact, we did not consider the effects of the morphological structure of the spherical marimo on the protection of PSII against the exposure to high illumination. Nonetheless, our results provide an indicator or clue to what may happen to the spherical marimo in Lake Akan. The fact of the cell death caused by the photoinhibitory treatment for only 6 h at 2 °C suggests that photoinhibition would be a serious threat to the surface part of marimo in the lake when global warming proceeds. The natural habitat of marimo receives more than 10 h of sunlight, even in winter. > > If the damage of the surface cells increases under the longer exposure to direct sunlight per day due to the thinning of ice or ice collapse, in an extreme case, this may affect maintenance of their round bodies and lead to the disappearance of giant marimo. There is another possibility. It is known that phytoplankton in lake water increases when the lake surface is unfrozen. This suggests a greater absorption of sunlight by the lake water, and it might alleviate photoinhibition in marimo at low temperatures. Nonetheless, the irreversible photoinhibition of PSII in the filamentous cells indicated by this study suggests that this may cause survival of marimo to be more difficult in the near future. If global warming proceeds, there must be a stage where ice will melt away to allow high light penetration to the lake bottom while the water temperature is still low. We need to monitor the environmental conditions in Lake Akan continuously and to examine characteristics of the photoinhibition and repair at low temperatures in the spherical marimo themselves. Furthermore, we must urgently deal with protecting the marimo habitat.
So, as far as this sort of research goes, it's very much preliminary. They have identified a set of environmental conditions which is dangerous to the marimo in the lab, but they do not actually how much warming there needs to be in order for those conditions to occur in the real world (any journal of greater quality than MDPI would have demanded that from them) - or even if they would necessarily occur at all.
BurnerAcc2020 t1_iw34tgd wrote
Reply to comment by tornpentacle in New Nature study finds fungi and spore all over the filaments of an overused mask and demonstrates humid air filtration efficiency is compromised prolonged wearing - Title: "assessing the consequences of prolonged usage of disposable face masks" by IceGroundbreaking715
If you are interested, he is hardly alone in making these criticisms. Check out these comments from when I posted this on a different sub myself.
BurnerAcc2020 t1_iv1dhk5 wrote
Reply to comment by [deleted] in Viruses can ‘hitchhike’ on microplastics. More than 98 per cent of the virus scientists used was found on the microplastic, and over half of the viruses could still be detected 10 days later – much longer than if the virus particles were free-floating in the water by Wagamaga
If it's a soup, then it's a rather thin gruel, thankfully.
https://www.sciencedirect.com/science/article/pii/S026974912036187X
> Despite the ubiquitous and persistent presence of microplastic (MP) in marine ecosystems, knowledge of its potential harmful ecological effects is low. In this work, we assessed the risk of floating MP (1 μm–5 mm) to marine ecosystems by comparing ambient concentrations in the global ocean with available ecotoxicity data. The integration of twenty-three species-specific effect threshold concentration data in a species sensitivity distribution yielded a median unacceptable level of 1.21 ∗ 10^5 MP m^-3 (95% CI: 7.99 ∗ 10^-3 – 1.49 ∗ 106 MP m^-3). > > We found that in 2010 for 0.17% of the surface layer (0–5 m) of the global ocean a threatening risk would occur. By 2050 and 2100, this fraction increases to 0.52% and 1.62%, respectively, according to the worst-case predicted future plastic discharge into the ocean. Our results reveal a spatial and multidecadal variability of MP-related risk at the global ocean surface. For example, we have identified the Mediterranean Sea and the Yellow Sea as hotspots of marine microplastic risks already now and even more pronounced in future decades.
Permafrost thaw is usually expected to emit CO2 on net. Instead, a 37-year analysis of the northern high latitude regions found that for now, permafrost-rich areas have been absorbing more CO2 as they get warmer. However, northern forests are absorbing less carbon than predicted by the models.
nature.comSubmitted by BurnerAcc2020 t3_xsvill in science
BurnerAcc2020 t1_je94lhc wrote
Reply to comment by bojangs101 in We’re halfway to a tipping point that would trigger 6 feet of sea level rise from melting of the Greenland Ice Sheet by Bored-sideline
Yeah, and check how many times it's been moved around.
https://pilgrimhall.org/plymouth_rock.htm